

Question: Help with this Question! Question 3: Use the historical financial data for Hershey's for 2021A to generate an estimate of the Additional Funds Needed and
Help with this Question!
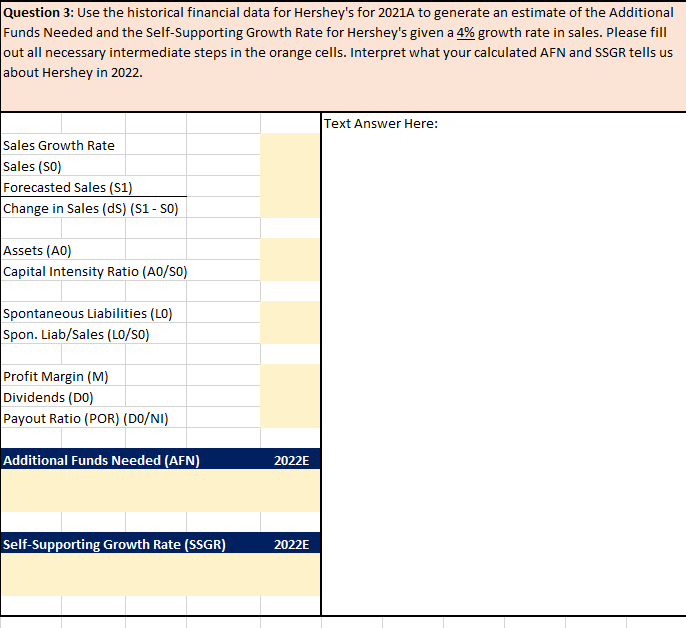
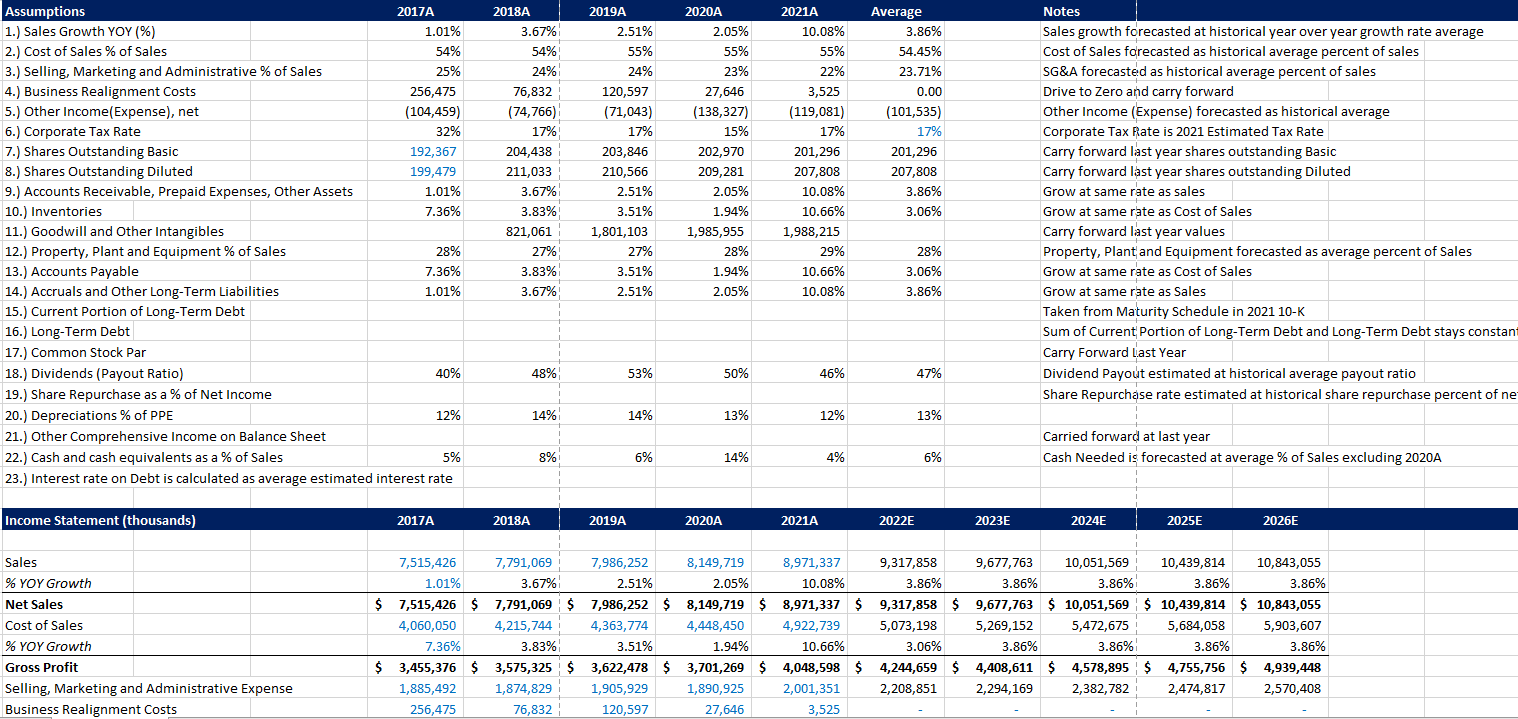
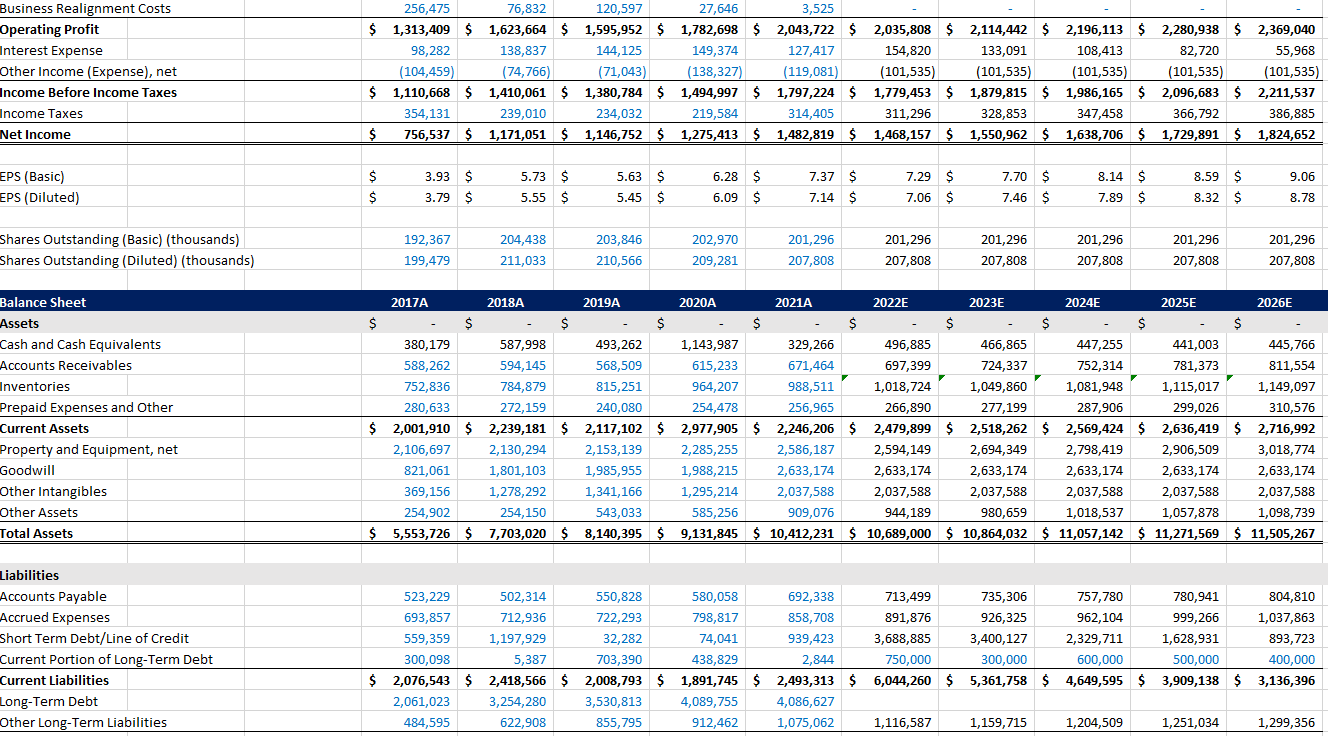
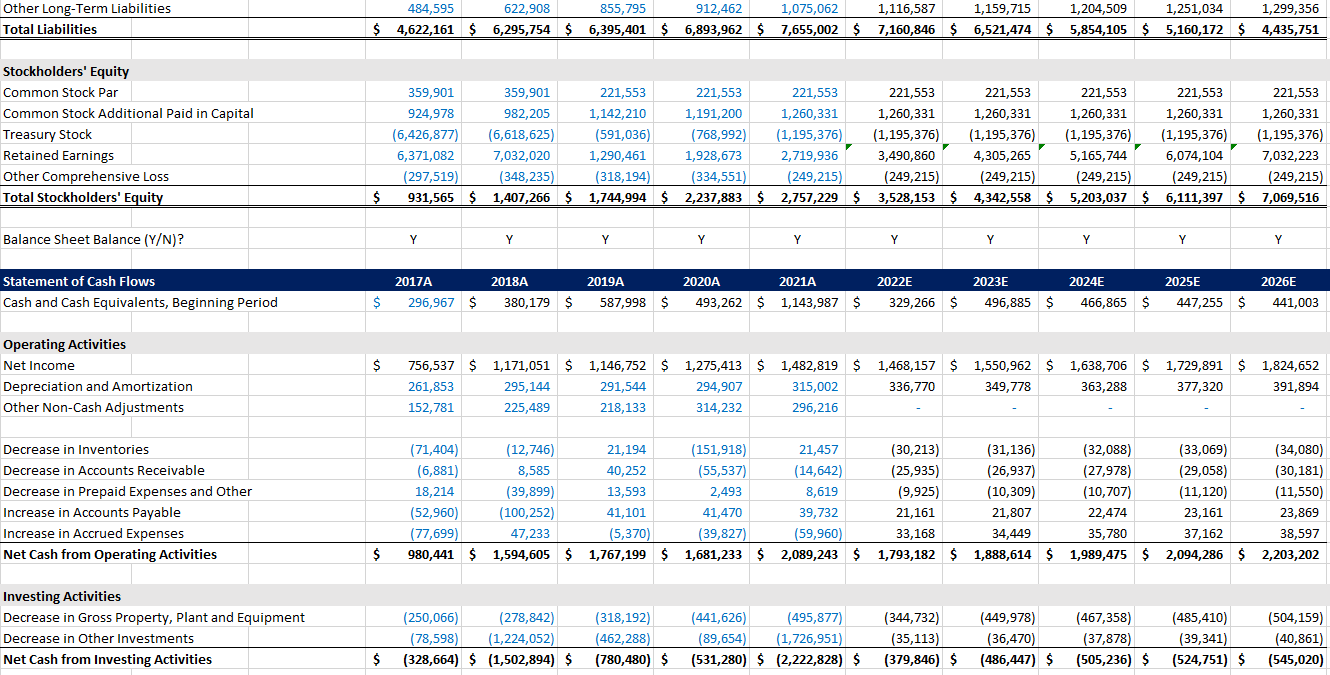
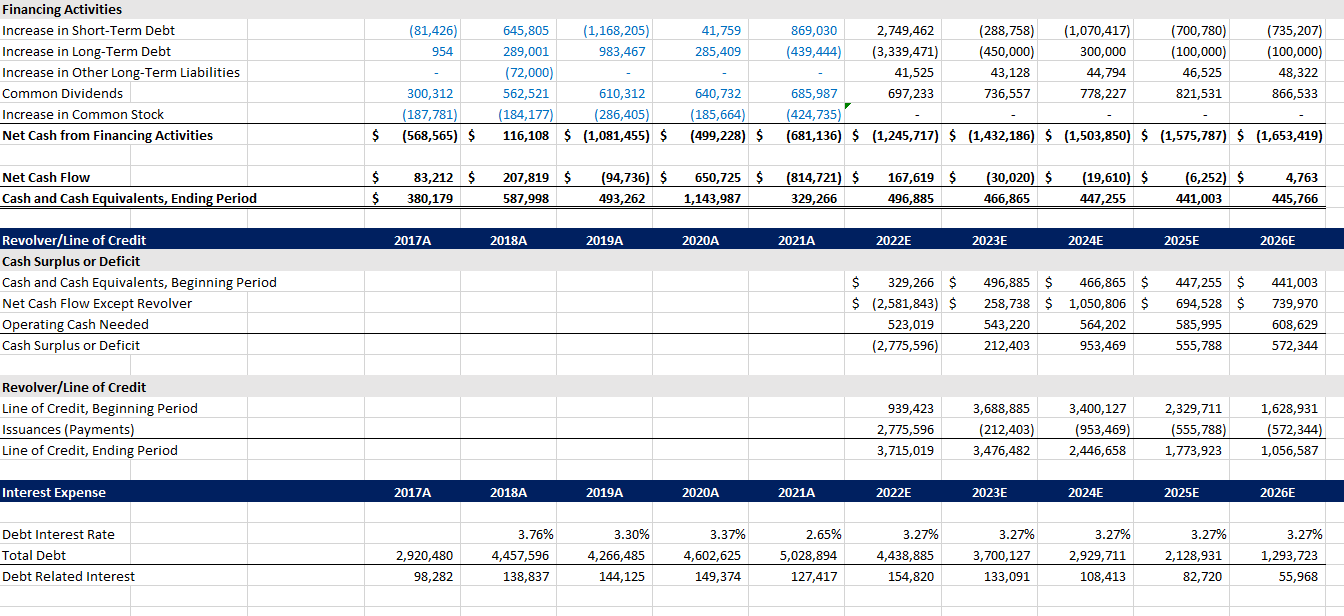
Question 3: Use the historical financial data for Hershey's for 2021A to generate an estimate of the Additional Funds Needed and the Self-Supporting Growth Rate for Hershey's given a 4% growth rate in sales. Please fill out all necessary intermediate steps in the orange cells. Interpret what your calculated AFN and SSGR tells us about Hershey in 2022. Text Answer Here: Sales Growth Rate Sales (SO) Forecasted Sales (51) Change in Sales (ds) (S1-SO) Assets (AO) Capital Intensity Ratio (AO/SO) Spontaneous Liabilities (LO) Spon. Liab/Sales (L0/SO) Profit Margin (M) Dividends (DO) Payout Ratio (POR) (DO/NI) Additional Funds Needed (AFN) 2022E Self-Supporting Growth Rate (SSGR) 2022E Assumptions 2017A 1.) Sales Growth YOY (%) 1.01% 2.) Cost of Sales % of Sales 54% 3.) Selling, Marketing and Administrative % of Sales 25% 4.) Business Realignment Costs 256,475 5.) Other Income (Expense), net (104,459) 6.) Corporate Tax Rate 32% 7.) Shares Outstanding Basic 192,367 8.) Shares Outstanding Diluted 199,479 9.) Accounts Receivable, Prepaid Expenses, Other Assets 1.01% 10.) Inventories 7.36% 11.) Goodwill and Other Intangibles 12.) Property, plant and Equipment % of Sales 28% 13.) Accounts Payable 7.36% 14.) Accruals and Other Long-Term Liabilities 1.01% 15.) Current Portion of Long-Term Debt 16.) Long-Term Debt 17.) Common Stock Par 18.) Dividends (Payout Ratio) 40% 19.) Share Repurchase as a % of Net Income 20.) Depreciations % of PPE 12% 21.) Other Comprehensive Income on Balance Sheet 22.) Cash and cash equivalents as a % of Sales 5% 23.) Interest rate on Debt is calculated as average estimated interest rate 2018A 3.67% 54% 24% 76,832 (74,766) 17% 204,438 211,033 3.67% 3.83% 821,061 27% 3.83% 3.67% 2019A 2.51% 55% 24% 120,597 (71,043) 17% 203,846 210,566 2.51% 3.51% 1,801,103 27% 3.51% 2.51% 2020A 2.05% 55% 23% 27,646 (138,327) 15% 202,970 209,281 2.05% 1.94% 1,985,955 28% 1.94% 2.05% 2021A 10.08% 55% 22% 3,525 (119,081) 17% 201,296 207,808 10.08% 10.66% 1,988,215 29% 10.66% 10.08% Average 3.86% 54.45% 23.71% 0.00 (101,535) 17% 201,296 207,808 3.86% 3.06% Notes Sales growth forecasted at historical year over year growth rate average Cost of Sales forecasted as historical average percent of sales SG&A forecasted as historical average percent of sales Drive to Zero and carry forward Other Income (Expense) forecasted as historical average Corporate Tax Rate is 2021 Estimated Tax Rate Carry forward last year shares outstanding Basic Carry forward last year shares outstanding Diluted Grow at same rate as sales Grow at same rate as Cost of Sales Carry forward last year values Property, Plant and Equipment forecasted as average percent of Sales Grow at same rate as Cost of Sales Grow at same rate as Sales Taken from Maturity Schedule in 2021 10-K Sum of Current Portion of Long-Term Debt and Long-Term Debt stays constant Carry Forward Last Year Dividend Payout estimated at historical average payout ratio Share Repurchase rate estimated at historical share repurchase percent of ne 28% 3.06% 3.86% 48% 53% 50% 46% 47% 14% 14% 13% 12% 13% Carried forward at last year Cash Needed is forecasted at average % of Sales excluding 2020A 8% 6% 14% 4% 6% Income Statement (thousands) 2017A 2018A 2019A 2020A 2021A 2022E 2023E 2024E 2025E 2026E Sales % YOY Growth Net Sales Cost of Sales % YOY Growth Gross Profit Selling, Marketing and Administrative Expense Business Realignment Costs 7,515,426 7,791,069 7,986,252 8,149,719 8,971,337 9,317,858 9,677,763 10,051,569 10,439,814 10,843,055 1.01% 3.67% 2.51% 2.05% 10.08% 3.86% 3.86% 3.86% 3.86% 3.86% $ 7,515,426 $ 7,791,069 $ 7,986,252 $ 8,149,719 $ 8,971,337 $ 9,317,858 $ 9,677,763 $ 10,051,569 $ 10,439,814 $ 10,843,055 4,060,050 4,215,744 4,363,774 4,448,450 4,922,739 5,073,198 5,269,152 5,472,675 5,684,058 5,903,607 7.36% 3.83% 3.51% 1.94% 10.66% 3.06% 3.86% 3.86% 3.86% 3.86% $ 3,455,376 $ 3,575,325$ 3,622,478 $ 3,701,269 $ 4,048,598 $ 4,244,659 $ 4,408,611 $ 4,578,895 $ 4,755,756 $ 4,939,448 1,885,492 1,874,829 1,905,929 1,890,925 2,001,351 2,208,851 2,294,169 2,382,782 2,474,817 2,570,408 256,475 76,832 120,597 27,646 3,525 Business Realignment Costs Operating Profit Interest Expense Other Income (Expense), net Income Before Income Taxes Income Taxes 256,475 76,832 120,597 27,646 3,525 $ 1,313,409 $ 1,623,664 $ 1,595,952 $ 1,782,698 $ 2,043,722 $ 2,035,808 $ 2,114,442 $ 2,196,113 $ 2,280,938 $ 2,369,040 98,282 138,837 144,125 149,374 127,417 154,820 133,091 108,413 82,720 55,968 (104,459) (74,766) (71,043) (138,327) (119,081) (101,535) (101,535) (101,535) (101,535) (101,535) $ 1,110,668 $ 1,410,061 $ 1,380,784 $ 1,494,997 $ 1,797,224 $ 1,779,453 $ 1,879,815 $ 1,986,165 $ 2,096,683 $ 2,211,537 354,131 239,010 234,032 219,584 314,405 311,296 328,853 347,458 366,792 386,885 $ 756,537 $ 1,171,051 $ 1,146,752 $ 1,275,413 $ 1,482,819 $ 1,468,157 $ 1,550,962 $ 1,638,706 $ 1,729,891 $ 1,824,652 Net Income 9.06 EPS (Basic) EPS (Diluted) $ $ 3.93 $ 3.79 $ 5.73 $ 5.55 $ 5.63 $ 5.45 $ 6.28 $ 6.09 $ 7.37 $ 7.14 $ 7.29 $ 7.06 $ 7.70 $ 7.46 $ 8.14 $ 7.89 $ 8.59 $ 8.32 $ 8.78 203,846 201,296 201.296 Shares Outstanding (Basic) (thousands) Shares Outstanding (Diluted) (thousands) 192,367 199,479 204,438 211,033 202,970 209,281 201,296 207,808 201,296 207,808 201,296 207,808 201,296 207,808 210,566 207,808 207,808 Balance Sheet Assets Cash and Cash Equivalents Accounts Receivables Inventories Prepaid Expenses and Other Current Assets Property and Equipment, net Goodwill Other Intangibles Other Assets Total Assets 2017A 2018A 2019A 2020A 2021A 2022E 2023E 2024E 2025E 2026E $ $ $ $ $ $ $ $ $ $ 380,179 587,998 493,262 1,143,987 329,266 496,885 466,865 447,255 441,003 445,766 588,262 594,145 568,509 615,233 671,464 697,399 724,337 752,314 781,373 811,554 752,836 784,879 815,251 964,207 988,511 1,018,724 1,049,860 1,081,948 1,115,017 1,149,097 280,633 272,159 240,080 254,478 256,965 266,890 277,199 287,906 299,026 310,576 $ 2,001,910 $ 2,239,181 $ 2,117,102 $ 2,977,905 $ 2,246,206 $ 2,479,899 $ 2,518,262 $ 2,569,424 $ 2,636,419 $ 2,716,992 2,106,697 2,130,294 2,153,139 2,285,255 2,586,187 2,594,149 2,694,349 2,798,419 2,906,509 3,018,774 821,061 1,801,103 1,985,955 1,988,215 2,633, 174 2,633, 174 2,633, 174 2,633,174 2,633,174 2,633,174 369,156 1,278,292 1,341,166 1,295,214 2,037,588 2,037,588 2,037,588 2,037,588 2,037,588 254,902 254,150 543,033 585,256 909,076 944,189 980,659 1,018,537 1,057,878 1,098,739 $ 5,553,726 $ 7,703,020 $ 8,140,395 $ 9,131,845 $ 10,412,231 $ 10,689,000 $10,864,032 $ 11,057,142 $ 11,271,569 $ 11,505,267 2,037,588 Liabilities Accounts Payable Accrued Expenses Short Term Debt/Line of Credit Current Portion of Long-Term Debt Current Liabilities Long-Term Debt Other Long-Term Liabilities 523,229 502,314 550,828 580,058 692,338 713,499 735,306 757,780 780,941 804,810 693,857 712,936 722,293 798,817 858,708 891,876 926,325 962,104 999,266 1,037,863 559,359 1,197,929 32,282 74,041 939,423 3,688,885 3,400,127 2,329,711 1,628,931 893,723 300,098 5,387 703,390 438,829 2,844 750,000 300,000 600,000 500,000 400,000 $ 2,076,543 $ 2,418,566 $ 2,008,793 $ 1,891,745 $ 2,493,313 $ 6,044,260 $ 5,361,758 $ 4,649,595 $ 3,909,138 $ 3,136,396 2,061,023 3,254,280 3,530,813 4,089,755 4,086,627 484,595 622,908 855,795 912,462 1,075,062 1,116,587 1,159,715 1,204,509 1,251,034 1,299,356 Other Long-Term Liabilities Total Liabilities 484,595 622,908 855,795 912,462 1,075,062 1,116,587 1,159,715 1,204,509 1,251,034 1,299,356 $ 4,622,161 $ 6,295,754 $ 6,395,401 $ 6,893,962 $ 7,655,002 $ 7,160,846 $ 6,521,474 $ 5,854,105 $ 5,160,172 $ 4,435,751 Stockholders' Equity Common Stock Par Common Stock Additional Paid in Capital Treasury Stock Retained Earnings Other Comprehensive Loss Total Stockholders' Equity 359,901 359,901 221,553 221,553 221,553 221,553 221,553 221,553 221,553 221,553 924,978 982.205 1,142,210 1,191,200 1,260,331 1,260,331 1,260,331 1,260,331 1,260,331 1,260,331 (6,426,877) (6,618,625) (591,036) (768,992) (1,195,376) (1,195,376) (1,195,376) (1,195,376) (1,195,376) (1,195,376) 6,371,082 7,032,020 1,290,461 1,928,673 2,719,936 3,490,860 4,305,265 5,165,744 6,074,104 7,032,223 (297,519) (348,235) (318,194) (334,551) (249,215) (249,215) (249,215) (249,215) (249,215) (249,215) 931,565 $ 1,407,266 $ 1,744,994 $ 2,237,883 $ 2,757,229 $ 3,528,153 $ 4,342,558 $ 5,203,037 $ 6,111,397 $ 7,069,516 $ Balance Sheet Balance (Y/N)? Y Y Y Y Y Y Y Y Y Y 2018A 2022E 2023E 2026E Statement of Cash Flows Cash and Cash Equivalents, Beginning Period 2017A 296,967 $ 2019A 587,998 $ 2020A 2021A 493,262 $ 1,143,987 $ 2024E 466,865 $ 2025E 447,255 $ $ 380,179 $ 329,266 $ 496,885 $ 441,003 $ Operating Activities Net Income Depreciation and Amortization Other Non-Cash Adjustments 756,537 $ 1,171,051 $ 1,146,752 $ 1,275,413 $ 1,482,819 $ 1,468,157 $ 1,550,962 $ 1,638,706 $ 1,729,891 $ 1,824,652 261,853 295,144 291,544 294,907 315,002 336,770 349,778 363,288 377,320 391,894 152,781 225,489 218,133 314,232 296,216 2,493 Decrease in Inventories Decrease in Accounts Receivable Decrease in Prepaid Expenses and Other Increase in Accounts Payable Increase in Accrued Expenses Net Cash from Operating Activities (71,404) (12,746) 21,194 (151,918) 21,457 (30,213) (31,136) (32,088) (33,069) (34,080) (6,881) 8,585 40,252 (55,537) (14,642) (25,935) (26,937) (27,978) (29,058) (30,181) 18,214 (39,899) 13,593 8,619 (9,925) (10,309) (10,707) (11,120) (11,550) (52,960) (100,252) 41,101 41,470 39,732 21,161 21,807 22,474 23,161 23,869 (77,699) 47,233 (5,370) (39,827) (59,960) 33,168 34,449 35,780 37,162 38,597 980,441 $ 1,594,605 $ 1,767,199 $ 1,681,233 $ 2,089,243 $ 1,793,182 $ 1,888,614 $ 1,989,475 $ 2,094,286 $ 2,203,202 $ Investing Activities Decrease in Gross Property, Plant and Equipment Decrease in Other Investments Net Cash from Investing Activities (250,066) (278,842) (78,598) (1,224,052) (328,664) $ (1,502,894) $ (318,192) (462,288) (780,480) $ (441,626) (495,877) (89,654) (1,726,951) (531,280) $ (2,222,828) $ (344,732) (35,113) (379,846) $ (449,978) (36,470) (486,447) $ (467,358) (37,878) (505,236) $ (485,410) (39,341) (524,751) $ (504,159) (40,861) (545,020) $ (81,426) 954 41,759 285,409 Financing Activities Increase in Short-Term Debt Increase in Long-Term Debt Increase in Other Long-Term Liabilities Common Dividends Increase in Common Stock Net Cash from Financing Activities 645,805 (1,168,205) 289,001 983,467 (72,000) 562,521 610,312 (184,177) (286,405) 116,108 $ (1,081,455) $ 869,030 2,749,462 (288,758) (1,070,417) (700,780) (735,207) (439,444) (3,339,471) (450,000) 300,000 (100,000) (100,000) 41,525 43,128 44,794 46,525 48,322 685,987 697,233 736,557 778,227 821,531 866,533 (424,735) (681,136) $ (1,245,717) $ (1,432,186) $ (1,503,850) $ (1,575,787) $ (1,653,419) 300,312 (187,781) (568,565) $ 640,732 (185,664) (499,228) $ $ Net Cash Flow Cash and Cash Equivalents, Ending Period $ $ 83,212 $ 380,179 207,819 $ 587,998 (94,736) $ 493,262 650,725 $ 1,143,987 (814,721) $ 329,266 167,619 $ 496,885 (30,020) $ 466,865 (19,610) $ 447,255 (6,252) $ 441,003 4,763 445,766 2017A 2018A 2019A 2020A 2021A 2022E 2023E 2024E 2025E 2026E Revolver/Line of Credit Cash Surplus or Deficit Cash and Cash Equivalents, Beginning Period Net Cash Flow Except Revolver Operating Cash Needed Cash Surplus or Deficit $ 329,266 $ $ (2,581,843) $ 523,019 (2,775,596) 496,885 $ 466,865 $ 258,738 $ 1,050,806 $ 543,220 564,202 212,403 953,469 447,255 $ 694,528 $ 585,995 555,788 441,003 739,970 608,629 572,344 Revolver/Line of Credit Line of Credit, Beginning Period Issuances (Payments) Line of Credit, Ending Period 939,423 2,775,596 3,715,019 3,688,885 (212,403) 3,476,482 3,400,127 (953,469) 2,446,658 2,329,711 (555,788) 1,773,923 1,628,931 (572,344) 1,056,587 Interest Expense 2017A 2018A 2019A 2020A 2021A 2022E 2023E 2024E 2025E 2026E Debt Interest Rate Total Debt Debt Related Interest 2,920,480 98,282 3.76% 4,457,596 138,837 3.30% 4,266,485 144,125 3.37% 4,602,625 149,374 2.65% 5,028,894 127,417 3.27% 4,438,885 154,820 3.27% 3,700,127 133,091 3.27% 2,929,711 108,413 3.27% 2,128,931 82,720 3.27% 1,293,723 55,968 Question 3: Use the historical financial data for Hershey's for 2021A to generate an estimate of the Additional Funds Needed and the Self-Supporting Growth Rate for Hershey's given a 4% growth rate in sales. Please fill out all necessary intermediate steps in the orange cells. Interpret what your calculated AFN and SSGR tells us about Hershey in 2022. Text Answer Here: Sales Growth Rate Sales (SO) Forecasted Sales (51) Change in Sales (ds) (S1-SO) Assets (AO) Capital Intensity Ratio (AO/SO) Spontaneous Liabilities (LO) Spon. Liab/Sales (L0/SO) Profit Margin (M) Dividends (DO) Payout Ratio (POR) (DO/NI) Additional Funds Needed (AFN) 2022E Self-Supporting Growth Rate (SSGR) 2022E Assumptions 2017A 1.) Sales Growth YOY (%) 1.01% 2.) Cost of Sales % of Sales 54% 3.) Selling, Marketing and Administrative % of Sales 25% 4.) Business Realignment Costs 256,475 5.) Other Income (Expense), net (104,459) 6.) Corporate Tax Rate 32% 7.) Shares Outstanding Basic 192,367 8.) Shares Outstanding Diluted 199,479 9.) Accounts Receivable, Prepaid Expenses, Other Assets 1.01% 10.) Inventories 7.36% 11.) Goodwill and Other Intangibles 12.) Property, plant and Equipment % of Sales 28% 13.) Accounts Payable 7.36% 14.) Accruals and Other Long-Term Liabilities 1.01% 15.) Current Portion of Long-Term Debt 16.) Long-Term Debt 17.) Common Stock Par 18.) Dividends (Payout Ratio) 40% 19.) Share Repurchase as a % of Net Income 20.) Depreciations % of PPE 12% 21.) Other Comprehensive Income on Balance Sheet 22.) Cash and cash equivalents as a % of Sales 5% 23.) Interest rate on Debt is calculated as average estimated interest rate 2018A 3.67% 54% 24% 76,832 (74,766) 17% 204,438 211,033 3.67% 3.83% 821,061 27% 3.83% 3.67% 2019A 2.51% 55% 24% 120,597 (71,043) 17% 203,846 210,566 2.51% 3.51% 1,801,103 27% 3.51% 2.51% 2020A 2.05% 55% 23% 27,646 (138,327) 15% 202,970 209,281 2.05% 1.94% 1,985,955 28% 1.94% 2.05% 2021A 10.08% 55% 22% 3,525 (119,081) 17% 201,296 207,808 10.08% 10.66% 1,988,215 29% 10.66% 10.08% Average 3.86% 54.45% 23.71% 0.00 (101,535) 17% 201,296 207,808 3.86% 3.06% Notes Sales growth forecasted at historical year over year growth rate average Cost of Sales forecasted as historical average percent of sales SG&A forecasted as historical average percent of sales Drive to Zero and carry forward Other Income (Expense) forecasted as historical average Corporate Tax Rate is 2021 Estimated Tax Rate Carry forward last year shares outstanding Basic Carry forward last year shares outstanding Diluted Grow at same rate as sales Grow at same rate as Cost of Sales Carry forward last year values Property, Plant and Equipment forecasted as average percent of Sales Grow at same rate as Cost of Sales Grow at same rate as Sales Taken from Maturity Schedule in 2021 10-K Sum of Current Portion of Long-Term Debt and Long-Term Debt stays constant Carry Forward Last Year Dividend Payout estimated at historical average payout ratio Share Repurchase rate estimated at historical share repurchase percent of ne 28% 3.06% 3.86% 48% 53% 50% 46% 47% 14% 14% 13% 12% 13% Carried forward at last year Cash Needed is forecasted at average % of Sales excluding 2020A 8% 6% 14% 4% 6% Income Statement (thousands) 2017A 2018A 2019A 2020A 2021A 2022E 2023E 2024E 2025E 2026E Sales % YOY Growth Net Sales Cost of Sales % YOY Growth Gross Profit Selling, Marketing and Administrative Expense Business Realignment Costs 7,515,426 7,791,069 7,986,252 8,149,719 8,971,337 9,317,858 9,677,763 10,051,569 10,439,814 10,843,055 1.01% 3.67% 2.51% 2.05% 10.08% 3.86% 3.86% 3.86% 3.86% 3.86% $ 7,515,426 $ 7,791,069 $ 7,986,252 $ 8,149,719 $ 8,971,337 $ 9,317,858 $ 9,677,763 $ 10,051,569 $ 10,439,814 $ 10,843,055 4,060,050 4,215,744 4,363,774 4,448,450 4,922,739 5,073,198 5,269,152 5,472,675 5,684,058 5,903,607 7.36% 3.83% 3.51% 1.94% 10.66% 3.06% 3.86% 3.86% 3.86% 3.86% $ 3,455,376 $ 3,575,325$ 3,622,478 $ 3,701,269 $ 4,048,598 $ 4,244,659 $ 4,408,611 $ 4,578,895 $ 4,755,756 $ 4,939,448 1,885,492 1,874,829 1,905,929 1,890,925 2,001,351 2,208,851 2,294,169 2,382,782 2,474,817 2,570,408 256,475 76,832 120,597 27,646 3,525 Business Realignment Costs Operating Profit Interest Expense Other Income (Expense), net Income Before Income Taxes Income Taxes 256,475 76,832 120,597 27,646 3,525 $ 1,313,409 $ 1,623,664 $ 1,595,952 $ 1,782,698 $ 2,043,722 $ 2,035,808 $ 2,114,442 $ 2,196,113 $ 2,280,938 $ 2,369,040 98,282 138,837 144,125 149,374 127,417 154,820 133,091 108,413 82,720 55,968 (104,459) (74,766) (71,043) (138,327) (119,081) (101,535) (101,535) (101,535) (101,535) (101,535) $ 1,110,668 $ 1,410,061 $ 1,380,784 $ 1,494,997 $ 1,797,224 $ 1,779,453 $ 1,879,815 $ 1,986,165 $ 2,096,683 $ 2,211,537 354,131 239,010 234,032 219,584 314,405 311,296 328,853 347,458 366,792 386,885 $ 756,537 $ 1,171,051 $ 1,146,752 $ 1,275,413 $ 1,482,819 $ 1,468,157 $ 1,550,962 $ 1,638,706 $ 1,729,891 $ 1,824,652 Net Income 9.06 EPS (Basic) EPS (Diluted) $ $ 3.93 $ 3.79 $ 5.73 $ 5.55 $ 5.63 $ 5.45 $ 6.28 $ 6.09 $ 7.37 $ 7.14 $ 7.29 $ 7.06 $ 7.70 $ 7.46 $ 8.14 $ 7.89 $ 8.59 $ 8.32 $ 8.78 203,846 201,296 201.296 Shares Outstanding (Basic) (thousands) Shares Outstanding (Diluted) (thousands) 192,367 199,479 204,438 211,033 202,970 209,281 201,296 207,808 201,296 207,808 201,296 207,808 201,296 207,808 210,566 207,808 207,808 Balance Sheet Assets Cash and Cash Equivalents Accounts Receivables Inventories Prepaid Expenses and Other Current Assets Property and Equipment, net Goodwill Other Intangibles Other Assets Total Assets 2017A 2018A 2019A 2020A 2021A 2022E 2023E 2024E 2025E 2026E $ $ $ $ $ $ $ $ $ $ 380,179 587,998 493,262 1,143,987 329,266 496,885 466,865 447,255 441,003 445,766 588,262 594,145 568,509 615,233 671,464 697,399 724,337 752,314 781,373 811,554 752,836 784,879 815,251 964,207 988,511 1,018,724 1,049,860 1,081,948 1,115,017 1,149,097 280,633 272,159 240,080 254,478 256,965 266,890 277,199 287,906 299,026 310,576 $ 2,001,910 $ 2,239,181 $ 2,117,102 $ 2,977,905 $ 2,246,206 $ 2,479,899 $ 2,518,262 $ 2,569,424 $ 2,636,419 $ 2,716,992 2,106,697 2,130,294 2,153,139 2,285,255 2,586,187 2,594,149 2,694,349 2,798,419 2,906,509 3,018,774 821,061 1,801,103 1,985,955 1,988,215 2,633, 174 2,633, 174 2,633, 174 2,633,174 2,633,174 2,633,174 369,156 1,278,292 1,341,166 1,295,214 2,037,588 2,037,588 2,037,588 2,037,588 2,037,588 254,902 254,150 543,033 585,256 909,076 944,189 980,659 1,018,537 1,057,878 1,098,739 $ 5,553,726 $ 7,703,020 $ 8,140,395 $ 9,131,845 $ 10,412,231 $ 10,689,000 $10,864,032 $ 11,057,142 $ 11,271,569 $ 11,505,267 2,037,588 Liabilities Accounts Payable Accrued Expenses Short Term Debt/Line of Credit Current Portion of Long-Term Debt Current Liabilities Long-Term Debt Other Long-Term Liabilities 523,229 502,314 550,828 580,058 692,338 713,499 735,306 757,780 780,941 804,810 693,857 712,936 722,293 798,817 858,708 891,876 926,325 962,104 999,266 1,037,863 559,359 1,197,929 32,282 74,041 939,423 3,688,885 3,400,127 2,329,711 1,628,931 893,723 300,098 5,387 703,390 438,829 2,844 750,000 300,000 600,000 500,000 400,000 $ 2,076,543 $ 2,418,566 $ 2,008,793 $ 1,891,745 $ 2,493,313 $ 6,044,260 $ 5,361,758 $ 4,649,595 $ 3,909,138 $ 3,136,396 2,061,023 3,254,280 3,530,813 4,089,755 4,086,627 484,595 622,908 855,795 912,462 1,075,062 1,116,587 1,159,715 1,204,509 1,251,034 1,299,356 Other Long-Term Liabilities Total Liabilities 484,595 622,908 855,795 912,462 1,075,062 1,116,587 1,159,715 1,204,509 1,251,034 1,299,356 $ 4,622,161 $ 6,295,754 $ 6,395,401 $ 6,893,962 $ 7,655,002 $ 7,160,846 $ 6,521,474 $ 5,854,105 $ 5,160,172 $ 4,435,751 Stockholders' Equity Common Stock Par Common Stock Additional Paid in Capital Treasury Stock Retained Earnings Other Comprehensive Loss Total Stockholders' Equity 359,901 359,901 221,553 221,553 221,553 221,553 221,553 221,553 221,553 221,553 924,978 982.205 1,142,210 1,191,200 1,260,331 1,260,331 1,260,331 1,260,331 1,260,331 1,260,331 (6,426,877) (6,618,625) (591,036) (768,992) (1,195,376) (1,195,376) (1,195,376) (1,195,376) (1,195,376) (1,195,376) 6,371,082 7,032,020 1,290,461 1,928,673 2,719,936 3,490,860 4,305,265 5,165,744 6,074,104 7,032,223 (297,519) (348,235) (318,194) (334,551) (249,215) (249,215) (249,215) (249,215) (249,215) (249,215) 931,565 $ 1,407,266 $ 1,744,994 $ 2,237,883 $ 2,757,229 $ 3,528,153 $ 4,342,558 $ 5,203,037 $ 6,111,397 $ 7,069,516 $ Balance Sheet Balance (Y/N)? Y Y Y Y Y Y Y Y Y Y 2018A 2022E 2023E 2026E Statement of Cash Flows Cash and Cash Equivalents, Beginning Period 2017A 296,967 $ 2019A 587,998 $ 2020A 2021A 493,262 $ 1,143,987 $ 2024E 466,865 $ 2025E 447,255 $ $ 380,179 $ 329,266 $ 496,885 $ 441,003 $ Operating Activities Net Income Depreciation and Amortization Other Non-Cash Adjustments 756,537 $ 1,171,051 $ 1,146,752 $ 1,275,413 $ 1,482,819 $ 1,468,157 $ 1,550,962 $ 1,638,706 $ 1,729,891 $ 1,824,652 261,853 295,144 291,544 294,907 315,002 336,770 349,778 363,288 377,320 391,894 152,781 225,489 218,133 314,232 296,216 2,493 Decrease in Inventories Decrease in Accounts Receivable Decrease in Prepaid Expenses and Other Increase in Accounts Payable Increase in Accrued Expenses Net Cash from Operating Activities (71,404) (12,746) 21,194 (151,918) 21,457 (30,213) (31,136) (32,088) (33,069) (34,080) (6,881) 8,585 40,252 (55,537) (14,642) (25,935) (26,937) (27,978) (29,058) (30,181) 18,214 (39,899) 13,593 8,619 (9,925) (10,309) (10,707) (11,120) (11,550) (52,960) (100,252) 41,101 41,470 39,732 21,161 21,807 22,474 23,161 23,869 (77,699) 47,233 (5,370) (39,827) (59,960) 33,168 34,449 35,780 37,162 38,597 980,441 $ 1,594,605 $ 1,767,199 $ 1,681,233 $ 2,089,243 $ 1,793,182 $ 1,888,614 $ 1,989,475 $ 2,094,286 $ 2,203,202 $ Investing Activities Decrease in Gross Property, Plant and Equipment Decrease in Other Investments Net Cash from Investing Activities (250,066) (278,842) (78,598) (1,224,052) (328,664) $ (1,502,894) $ (318,192) (462,288) (780,480) $ (441,626) (495,877) (89,654) (1,726,951) (531,280) $ (2,222,828) $ (344,732) (35,113) (379,846) $ (449,978) (36,470) (486,447) $ (467,358) (37,878) (505,236) $ (485,410) (39,341) (524,751) $ (504,159) (40,861) (545,020) $ (81,426) 954 41,759 285,409 Financing Activities Increase in Short-Term Debt Increase in Long-Term Debt Increase in Other Long-Term Liabilities Common Dividends Increase in Common Stock Net Cash from Financing Activities 645,805 (1,168,205) 289,001 983,467 (72,000) 562,521 610,312 (184,177) (286,405) 116,108 $ (1,081,455) $ 869,030 2,749,462 (288,758) (1,070,417) (700,780) (735,207) (439,444) (3,339,471) (450,000) 300,000 (100,000) (100,000) 41,525 43,128 44,794 46,525 48,322 685,987 697,233 736,557 778,227 821,531 866,533 (424,735) (681,136) $ (1,245,717) $ (1,432,186) $ (1,503,850) $ (1,575,787) $ (1,653,419) 300,312 (187,781) (568,565) $ 640,732 (185,664) (499,228) $ $ Net Cash Flow Cash and Cash Equivalents, Ending Period $ $ 83,212 $ 380,179 207,819 $ 587,998 (94,736) $ 493,262 650,725 $ 1,143,987 (814,721) $ 329,266 167,619 $ 496,885 (30,020) $ 466,865 (19,610) $ 447,255 (6,252) $ 441,003 4,763 445,766 2017A 2018A 2019A 2020A 2021A 2022E 2023E 2024E 2025E 2026E Revolver/Line of Credit Cash Surplus or Deficit Cash and Cash Equivalents, Beginning Period Net Cash Flow Except Revolver Operating Cash Needed Cash Surplus or Deficit $ 329,266 $ $ (2,581,843) $ 523,019 (2,775,596) 496,885 $ 466,865 $ 258,738 $ 1,050,806 $ 543,220 564,202 212,403 953,469 447,255 $ 694,528 $ 585,995 555,788 441,003 739,970 608,629 572,344 Revolver/Line of Credit Line of Credit, Beginning Period Issuances (Payments) Line of Credit, Ending Period 939,423 2,775,596 3,715,019 3,688,885 (212,403) 3,476,482 3,400,127 (953,469) 2,446,658 2,329,711 (555,788) 1,773,923 1,628,931 (572,344) 1,056,587 Interest Expense 2017A 2018A 2019A 2020A 2021A 2022E 2023E 2024E 2025E 2026E Debt Interest Rate Total Debt Debt Related Interest 2,920,480 98,282 3.76% 4,457,596 138,837 3.30% 4,266,485 144,125 3.37% 4,602,625 149,374 2.65% 5,028,894 127,417 3.27% 4,438,885 154,820 3.27% 3,700,127 133,091 3.27% 2,929,711 108,413 3.27% 2,128,931 82,720 3.27% 1,293,723 55,968
Step by Step Solution
There are 3 Steps involved in it

Get step-by-step solutions from verified subject matter experts