

Question: Search moSave om E Assignment 5(1) - Read-Only - Excel Home Insert DrawPage Layout Formulas Data Review View Help 2 & Cut 10 AA ZEEP
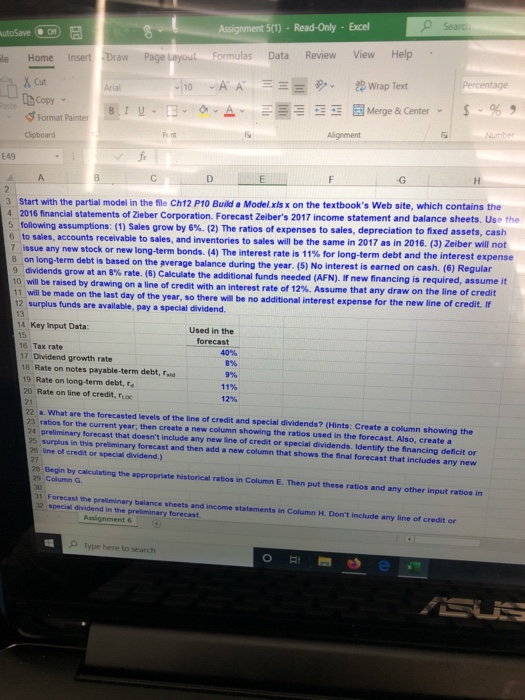
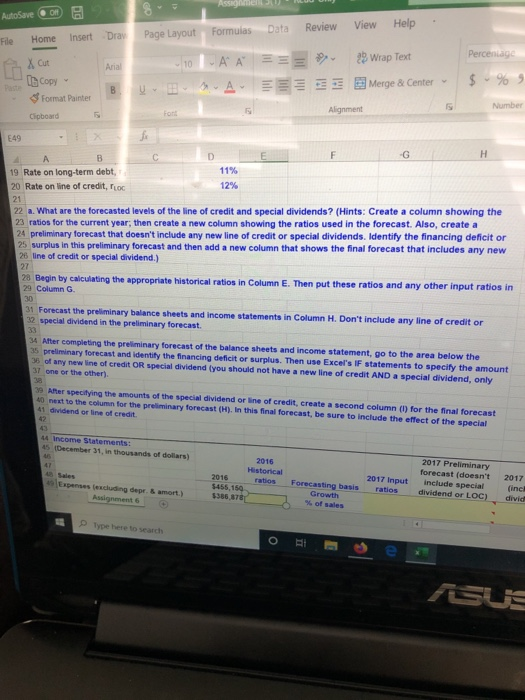
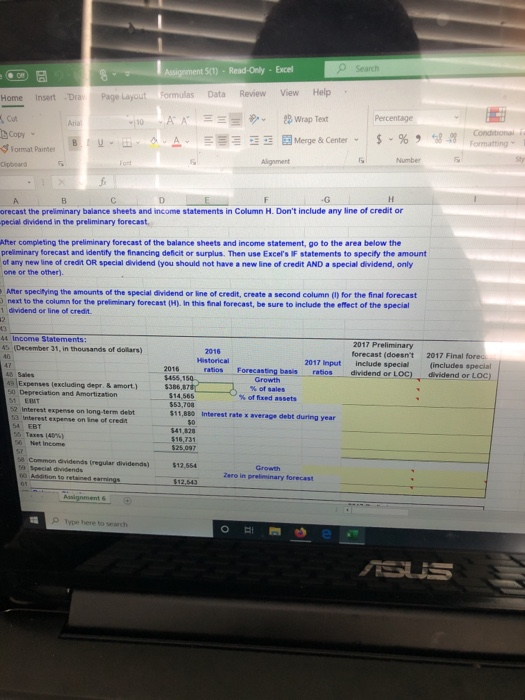
Search moSave om E Assignment 5(1) - Read-Only - Excel Home Insert DrawPage Layout Formulas Data Review View Help 2 & Cut 10 AA ZEEP Wrap Text Copy BIU E A Format Painter EEEE Merge & Center Clipboard Anment 3 Start with the partial model in the file Ch12 P10 Build a Model.xlsx on the textbook's Web site, which contains the 4 2016 financial statements of Zeber Corporation. Forecast Zeiber's 2017 income statement and balance sheets. Use the 5 following assumptions: (1) Sales grow by 6%. (2) The ratios of expenses to sales, depreciation to fixed assets, cash 6 to sales, accounts receivable to sales, and inventories to sales will be the same in 2017 as in 2016. (3) Zeiber will not Tissue any new stock or new long-term bonds. (4) The interest rate is 11% for long-term debt and the interest expense 8 on long-term debt is based on the average balance during the year. (5) No interest is earned on cash. (6) Regular 9 dividends grow at an 8% rate (6) Calculate the additional funds needed (AFN). If new financing is required, assume it 10 will be raised by drawing on a line of credit with an interest rate of 12%. Assume that any draw on the line of credit 11 will be made on the last day of the year, so there will be no additional interest expense for the new line of credit. If 12 surplus funds are available, pay a special dividend. 14 Key Input Data Used in the forecast 40% 16 Tax rate 17 Dividend growth rate 18 Rate on notes payable-term debt, 19 Rate on long-term debt, 20 Rate on line of credit, 72 What are the forecasted levels of the line of credit and special dividends (Hints: Create a column showing the 23 ratios for the current year, then create a new column showing the ratios used in the forecast. Also, create a 24 preliminary forecast that doesn't include any new line of credit or special dividends. Identify the financing deficit or 25 surplus in this preliminary forecast and then add a new column that shows the final forecast that includes any new 25 line of credit or special dividend.) 2 Begin by calculating the appropriate historical ratios in Column E. Then put these ratios and any other input ratios in 29 Column G Forecast the w ay bance sheets and income statements C o ntinclude any me of creato Type here to search Data Review Formulas View Help . Percentage AutoSave O File Home Insert DrawPage Layout Aria 10 BU 3 Format Painter AA 33 A 23 Wrap Text Merge & Center - in Copy $ - % s B - Ala 19 Rate on long-term debt, 20 Rate on line of credit, og 21 22 . What are the forecasted levels of the line of credit and special dividends? (Hints: Create a column showing the 23 ratios for the current year, then create a new column showing the ratios used in the forecast. Also, create a 24 preliminary forecast that doesn't include any new line of credit or special dividends. Identify the financing deficit or 25 surplus in this preliminary forecast and then add a new column that shows the final forecast that includes any new 25 Ine of credit or special dividend.) 28 Begin by calculating the appropriate Historical ratios in Column E. Then put these ratios and any other input ratios in 2 Column G 31 Forecast the preliminary balance sheets and income statements in Column H. Don't include any line of credit or 32 special dividend in the preliminary forecast. 34 After completing the preliminary forecast of the balance sheets and income statement, go to the area below the 35 preliminary forecast and identify the financing deficit or surplus. Then use Excel's IF statements to specify the amount of any new line of credit OR special dividend you should not have a new line of credit AND a special dividend, only 31 one or the other) A r specifying the amounts of the special dividend or line of credit, create a second column) for the final forecast next to the column for the primary forecast in this final forecast, be sure to include the effect of the special 41 dividend o ne of credit Income Statements: 2015 Historical 2016 ratios 1456,150 $386 878 2017 Preliminary forecast (doesn't include special dividend or LOC) 2017 input ratios Ex cluding desert Agent Forecasting basis Growth of sales 2017 inc divid e type here to search Search B B 8 Assignment 5(1) - Read-Only - Excel Page Layout Formulas Data Review View Insert Home Dray Help AA === Percentage Wrap Text Merge & Center Copy - Format Painter BU A $ % 98 -98 Conditional Formatting Alignment Number H A B C D E orecast the preliminary balance sheets and income statements in Column H. Don't include any line of credit or pecial dividend in the preliminary forecast After completing the preliminary forecast of the balance sheets and income statement, go to the area below the preliminary forecast and identify the financing deficit or surplus. Then use Excel's IF statements to specify the amount of any new line of credit OR special dividend you should not have a new line of credit AND a special dividend, only one or the other) After specifying the amounts of the special dividend or line of credit, create a second column (U) for the final forecast next to the column for the preliminary forecast (H). In this final forecast, be sure to include the effect of the special 1 dividend or line of credit. 44 Income Statements: 45 December 31, in thousands of dollars) 2016 Historical 2016 ratios $455.150 $386,875 2017 Preliminary forecast (doesn't include special dividend or LOC) 2017 input ratios Forecasting basis 2017 Final forec (includes special dividend or LOC) % of sales % of fixed assets A Sales 49 Expenses (excluding depr. & amort.) 50 Depreciation and Amortization 51 EMT 52 Interest expense on long-term debt 53 Interest expense on line of credit 54 EBT 55 Taxes (40%) 56 Net Income $53,700 $11,880 Interest rate x average debt during year 341,820 $16.731 s 58 Common dividends regular dividends) pecial dividends $12,554 Growth Zero in preliminary forecast $12.53 Type here to search ASUS Search moSave om E Assignment 5(1) - Read-Only - Excel Home Insert DrawPage Layout Formulas Data Review View Help 2 & Cut 10 AA ZEEP Wrap Text Copy BIU E A Format Painter EEEE Merge & Center Clipboard Anment 3 Start with the partial model in the file Ch12 P10 Build a Model.xlsx on the textbook's Web site, which contains the 4 2016 financial statements of Zeber Corporation. Forecast Zeiber's 2017 income statement and balance sheets. Use the 5 following assumptions: (1) Sales grow by 6%. (2) The ratios of expenses to sales, depreciation to fixed assets, cash 6 to sales, accounts receivable to sales, and inventories to sales will be the same in 2017 as in 2016. (3) Zeiber will not Tissue any new stock or new long-term bonds. (4) The interest rate is 11% for long-term debt and the interest expense 8 on long-term debt is based on the average balance during the year. (5) No interest is earned on cash. (6) Regular 9 dividends grow at an 8% rate (6) Calculate the additional funds needed (AFN). If new financing is required, assume it 10 will be raised by drawing on a line of credit with an interest rate of 12%. Assume that any draw on the line of credit 11 will be made on the last day of the year, so there will be no additional interest expense for the new line of credit. If 12 surplus funds are available, pay a special dividend. 14 Key Input Data Used in the forecast 40% 16 Tax rate 17 Dividend growth rate 18 Rate on notes payable-term debt, 19 Rate on long-term debt, 20 Rate on line of credit, 72 What are the forecasted levels of the line of credit and special dividends (Hints: Create a column showing the 23 ratios for the current year, then create a new column showing the ratios used in the forecast. Also, create a 24 preliminary forecast that doesn't include any new line of credit or special dividends. Identify the financing deficit or 25 surplus in this preliminary forecast and then add a new column that shows the final forecast that includes any new 25 line of credit or special dividend.) 2 Begin by calculating the appropriate historical ratios in Column E. Then put these ratios and any other input ratios in 29 Column G Forecast the w ay bance sheets and income statements C o ntinclude any me of creato Type here to search Data Review Formulas View Help . Percentage AutoSave O File Home Insert DrawPage Layout Aria 10 BU 3 Format Painter AA 33 A 23 Wrap Text Merge & Center - in Copy $ - % s B - Ala 19 Rate on long-term debt, 20 Rate on line of credit, og 21 22 . What are the forecasted levels of the line of credit and special dividends? (Hints: Create a column showing the 23 ratios for the current year, then create a new column showing the ratios used in the forecast. Also, create a 24 preliminary forecast that doesn't include any new line of credit or special dividends. Identify the financing deficit or 25 surplus in this preliminary forecast and then add a new column that shows the final forecast that includes any new 25 Ine of credit or special dividend.) 28 Begin by calculating the appropriate Historical ratios in Column E. Then put these ratios and any other input ratios in 2 Column G 31 Forecast the preliminary balance sheets and income statements in Column H. Don't include any line of credit or 32 special dividend in the preliminary forecast. 34 After completing the preliminary forecast of the balance sheets and income statement, go to the area below the 35 preliminary forecast and identify the financing deficit or surplus. Then use Excel's IF statements to specify the amount of any new line of credit OR special dividend you should not have a new line of credit AND a special dividend, only 31 one or the other) A r specifying the amounts of the special dividend or line of credit, create a second column) for the final forecast next to the column for the primary forecast in this final forecast, be sure to include the effect of the special 41 dividend o ne of credit Income Statements: 2015 Historical 2016 ratios 1456,150 $386 878 2017 Preliminary forecast (doesn't include special dividend or LOC) 2017 input ratios Ex cluding desert Agent Forecasting basis Growth of sales 2017 inc divid e type here to search Search B B 8 Assignment 5(1) - Read-Only - Excel Page Layout Formulas Data Review View Insert Home Dray Help AA === Percentage Wrap Text Merge & Center Copy - Format Painter BU A $ % 98 -98 Conditional Formatting Alignment Number H A B C D E orecast the preliminary balance sheets and income statements in Column H. Don't include any line of credit or pecial dividend in the preliminary forecast After completing the preliminary forecast of the balance sheets and income statement, go to the area below the preliminary forecast and identify the financing deficit or surplus. Then use Excel's IF statements to specify the amount of any new line of credit OR special dividend you should not have a new line of credit AND a special dividend, only one or the other) After specifying the amounts of the special dividend or line of credit, create a second column (U) for the final forecast next to the column for the preliminary forecast (H). In this final forecast, be sure to include the effect of the special 1 dividend or line of credit. 44 Income Statements: 45 December 31, in thousands of dollars) 2016 Historical 2016 ratios $455.150 $386,875 2017 Preliminary forecast (doesn't include special dividend or LOC) 2017 input ratios Forecasting basis 2017 Final forec (includes special dividend or LOC) % of sales % of fixed assets A Sales 49 Expenses (excluding depr. & amort.) 50 Depreciation and Amortization 51 EMT 52 Interest expense on long-term debt 53 Interest expense on line of credit 54 EBT 55 Taxes (40%) 56 Net Income $53,700 $11,880 Interest rate x average debt during year 341,820 $16.731 s 58 Common dividends regular dividends) pecial dividends $12,554 Growth Zero in preliminary forecast $12.53 Type here to search ASUS
Step by Step Solution
There are 3 Steps involved in it

Get step-by-step solutions from verified subject matter experts