

Question: Help with this question??? Thank You! (Please answer specifically, thank you!) (You can zoom in the picture) 10. Understanding the price leadership model Consider Kellogg's
Help with this question??? Thank You! (Please answer specifically, thank you!) (You can zoom in the picture)
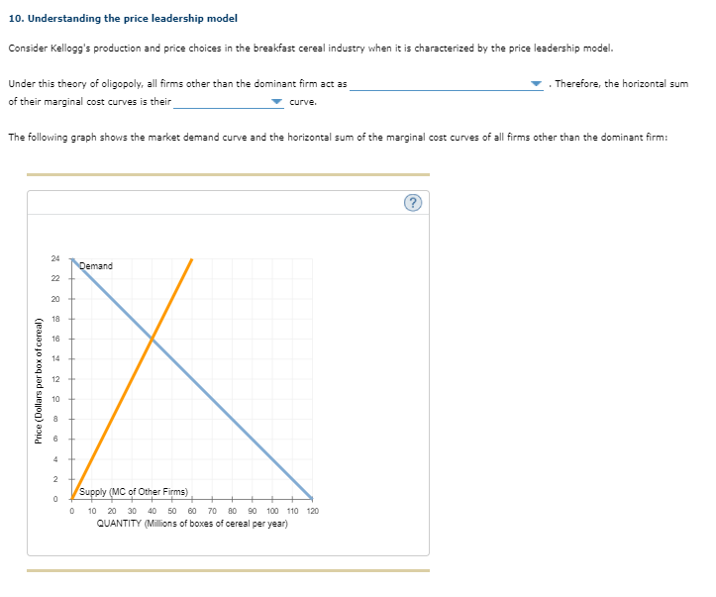
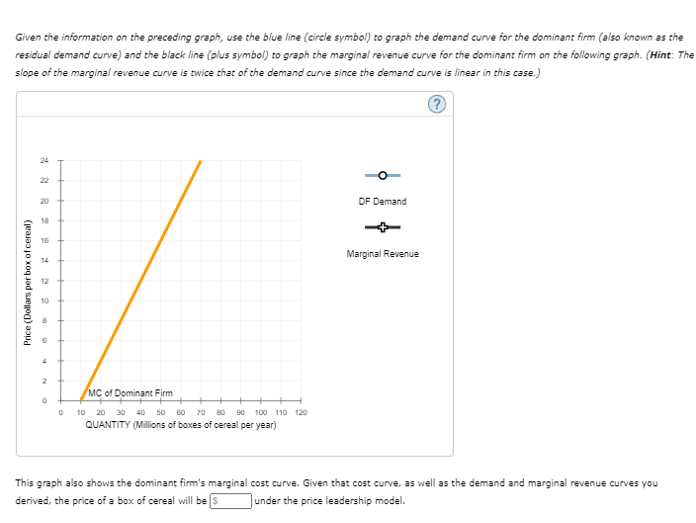
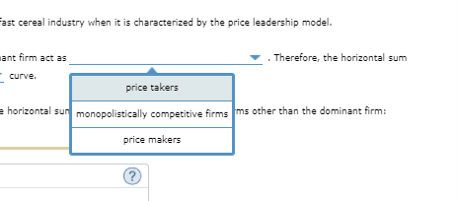
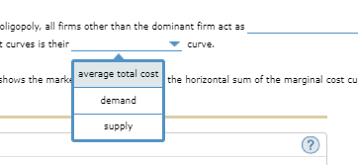
10. Understanding the price leadership model Consider Kellogg's production and price choices in the breakfast cereal industry when it is characterized by the price leadership model. Under this theory of oligopoly, all firms other than the dominant firm act as . Therefore, the horizontal sum of their marginal cost curves is their curve. The following graph shows the market demand curve and the horizontal sum of the marginal cost curves of all firms other than the dominant firm: (?) `Demand 22 20 Price (Dollars per box of cereal) Supply (MC of Other Firms) 0 20 30 40 50 60 70 80 90 100 110 120 QUANTITY (Millions of boxes of cereal per year)Given the information on the preceding graph, use the blue line (circle symbol) to graph the demand curve for the dominant firm (also known as the residual demand curve) and the black line (plus symbol) to graph the marginal revenue curve for the dominant firm on the following graph. (Hint: The slope of the marginal revenue curve is twice that of the demand curve since the demand curve is linear in this case.) 24 O 20 OF Demand Marginal Revenue Price (Dollars per box of cereal) MC of Dominant Firm 10 20 30 40 50 60 70 80 90 100 110 120 QUANTITY (Millions of boxes of cereal per year) This graph also shows the dominant firm's marginal cost curve. Given that cost curve, as well as the demand and marginal revenue curves you derived, the price of a box of cereal will be 5 under the price leadership model.ast cereal industry when it is characterized by the price leadership model. aint firm act as . Therefore, the horizontal sum curve. price takers horizontal sun monopolistically competitive firms ims other than the dominant firm: price makers ?oligopoly, all firms other than the dominant firm act as [ curves is their curve. shows the marks average total cost the horizontal sum of the marginal cost cu demand supply
Step by Step Solution
There are 3 Steps involved in it

Get step-by-step solutions from verified subject matter experts