

Question: Help writing code in MATLAB!!! WIP and throughput problem. Statistical Process Control. Write a computer program (i.e., MATLAB) to plot the Best Case, Worst Case
Help writing code in MATLAB!!!

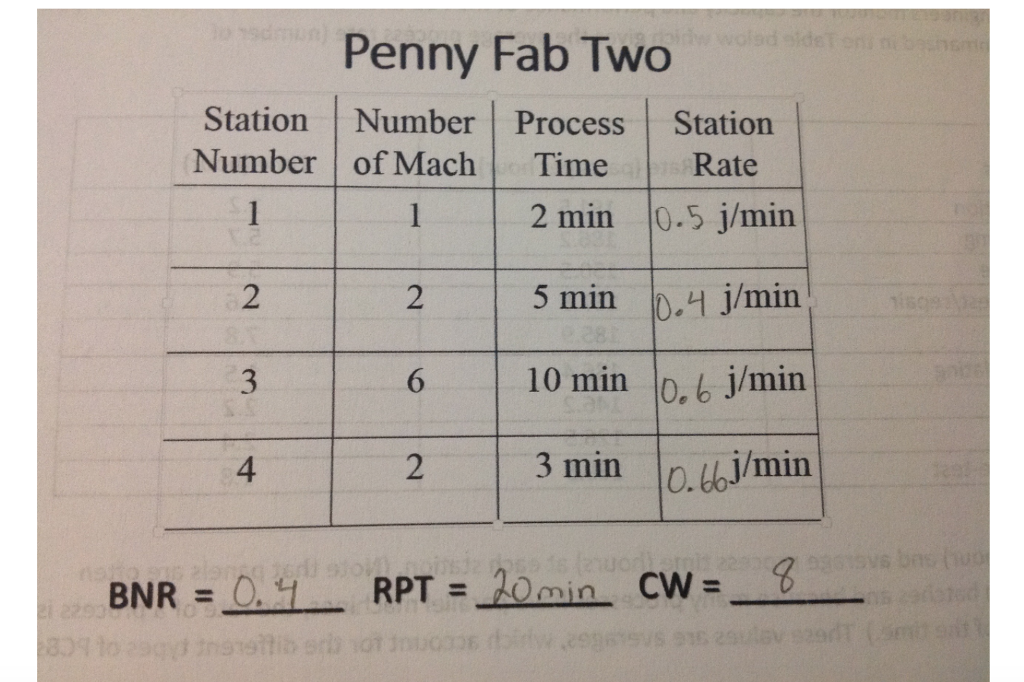
WIP and throughput problem. Statistical Process Control. Write a computer program (i.e., MATLAB) to plot the Best Case, Worst Case and Practical Worst Case curves for Penny Fab Il on a single figure. (See processing data in Table below.) Create two figures. The first figure should display throughput as a function of WIP and the second figure cycle time as a function of WIP. Allow WIP to vary from 1 to 50 for figure (1) and 1 to 30 for figure (2) Can you include the code too? That's the part that I need to learn. WIP and throughput problem. Statistical Process Control. Write a computer program (i.e., MATLAB) to plot the Best Case, Worst Case and Practical Worst Case curves for Penny Fab Il on a single figure. (See processing data in Table below.) Create two figures. The first figure should display throughput as a function of WIP and the second figure cycle time as a function of WIP. Allow WIP to vary from 1 to 50 for figure (1) and 1 to 30 for figure (2) Can you include the code too? That's the part that I need to learn
Step by Step Solution
There are 3 Steps involved in it

Get step-by-step solutions from verified subject matter experts