

Question: Part I. Penny Fab II Write a computer program in excel VBA to plot the Best Case, Worst Case and Practical Worst Case curves for
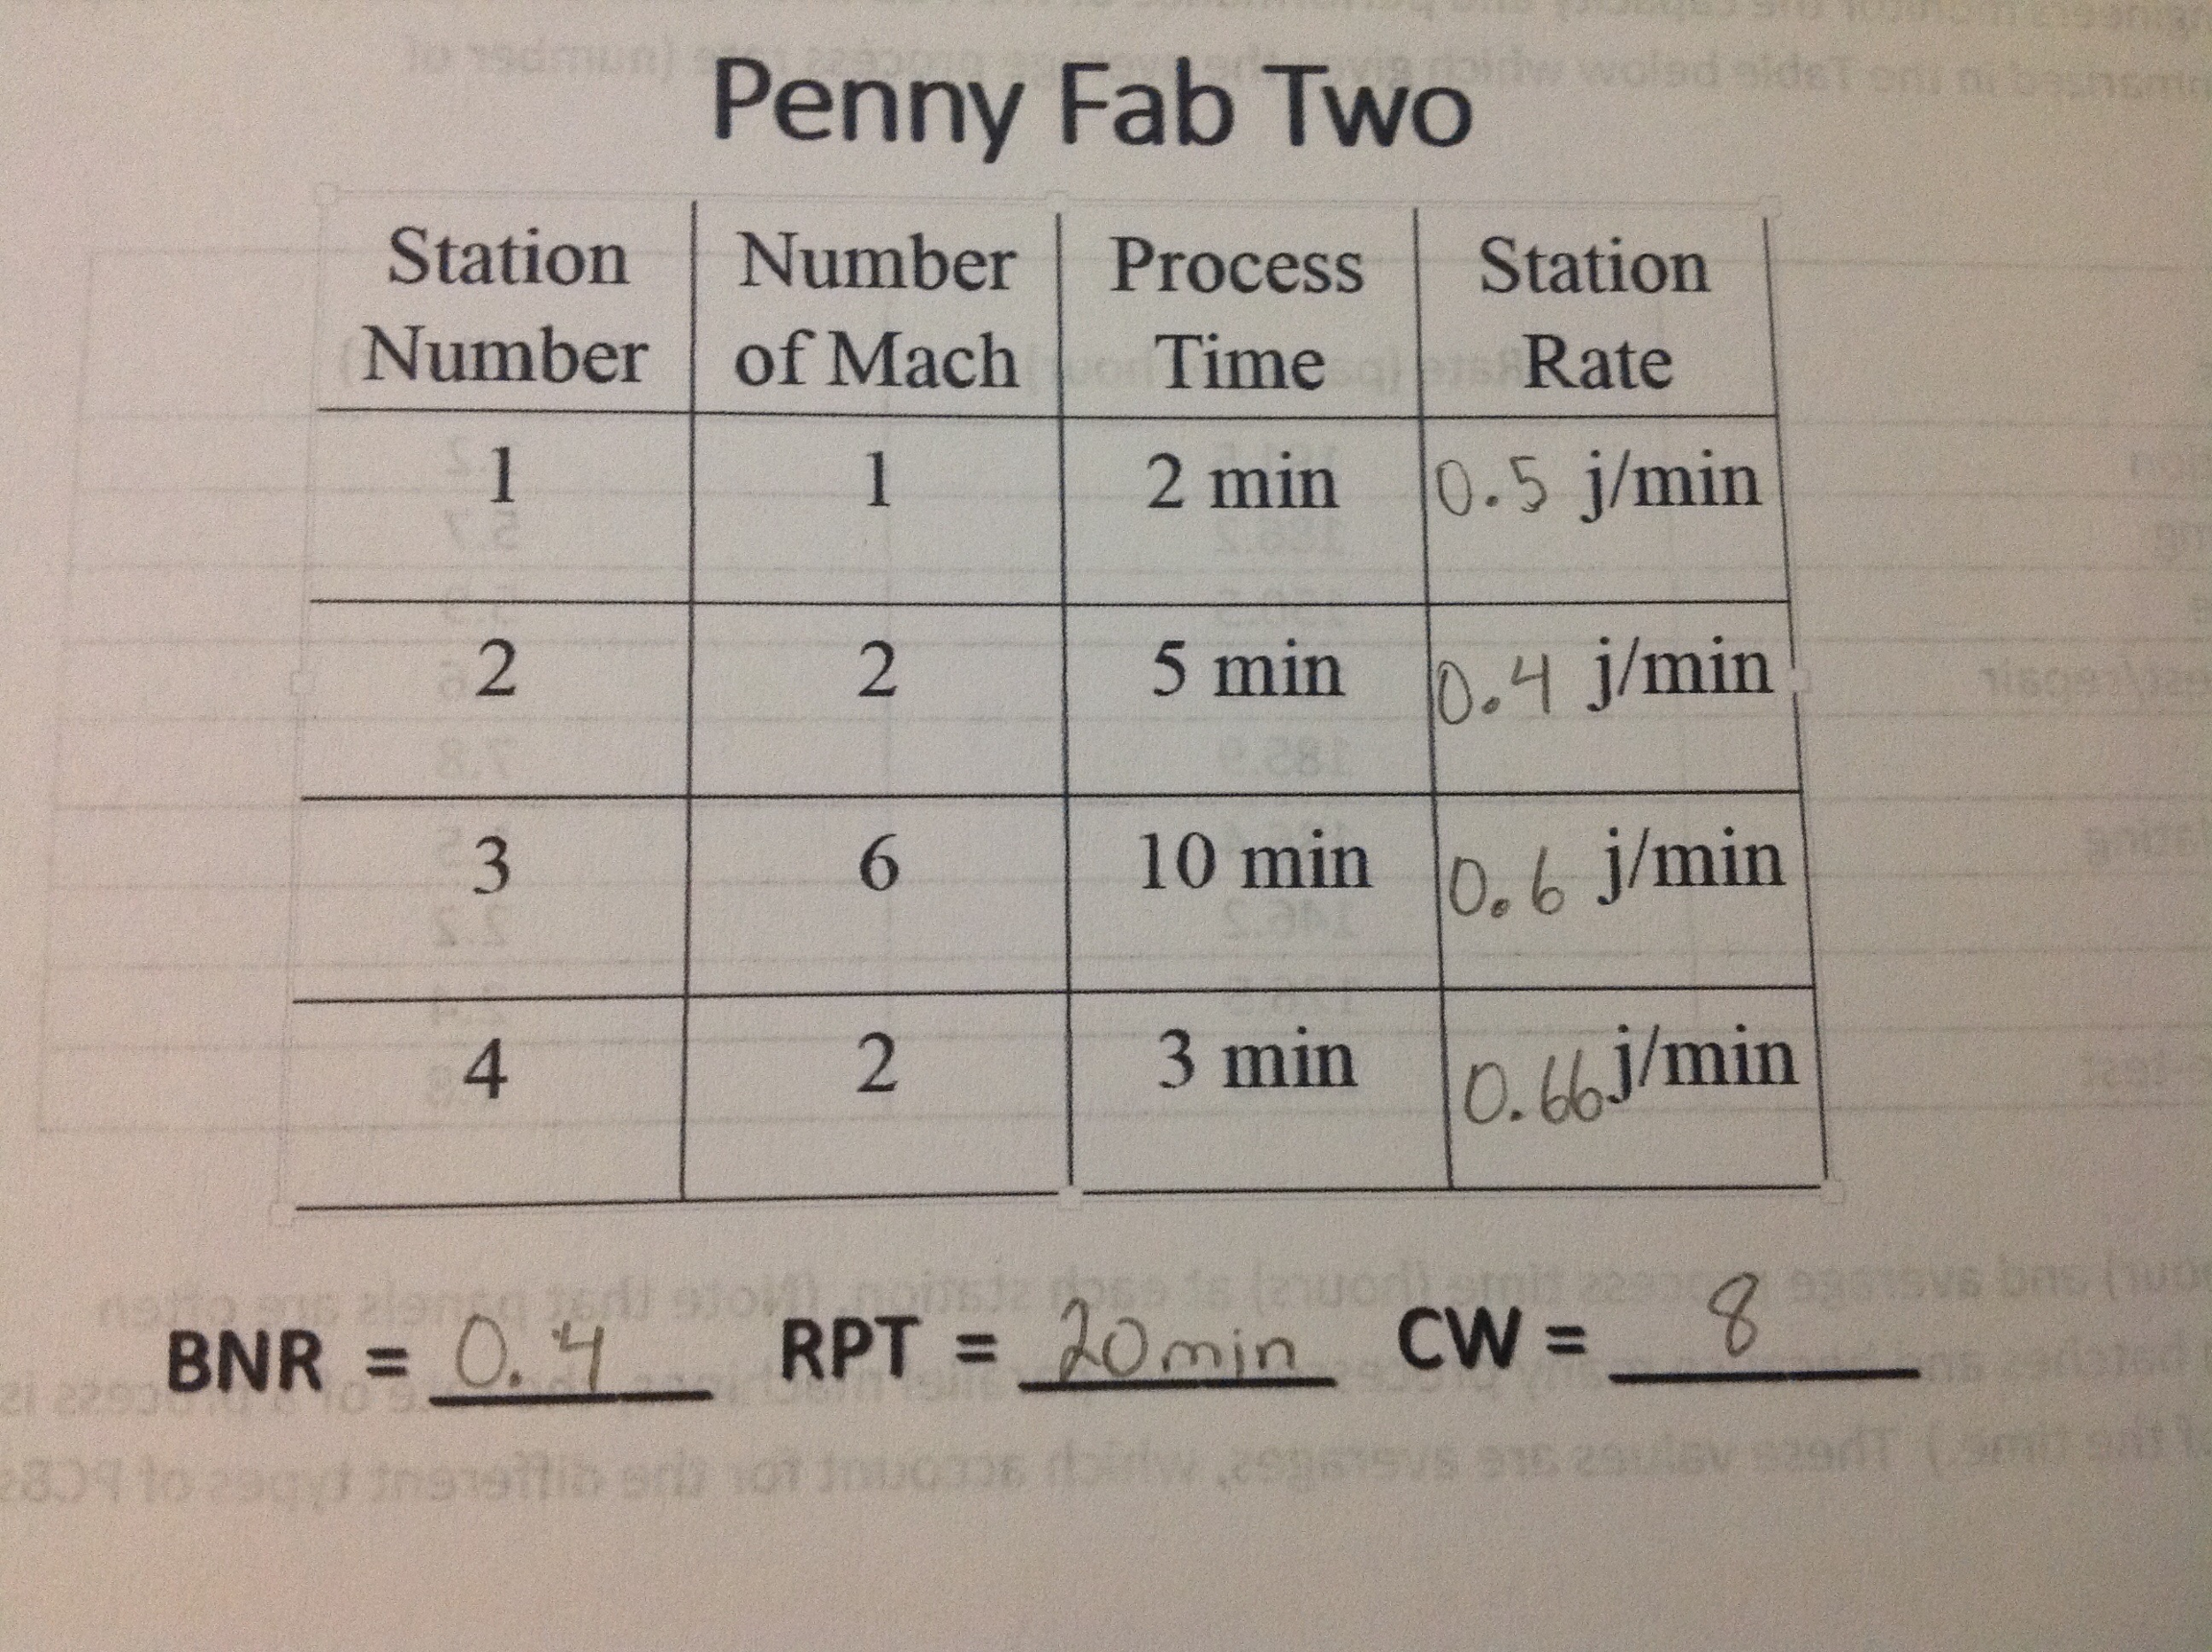
Part I. Penny Fab II Write a computer program in excel VBA to plot the Best Case, Worst Case and Practical Worst Case curves for Penny Fab II on a single figure. (See processing data in Table below.) Create two figures. The first figure should display throughput as a function of WIP and the second figure cycle time as a function of WIP. Allow WIP to vary from 1 to 50 for figure (1) and 1 to 30 for figure (2).
*please post the code so I can understand it please
Step by Step Solution
There are 3 Steps involved in it
1 Expert Approved Answer
Step: 1 Unlock

Question Has Been Solved by an Expert!
Get step-by-step solutions from verified subject matter experts
Step: 2 Unlock
Step: 3 Unlock