

Question: helpOUESTION 2 : A graph representing a statistical process control chart for the production of gnomes. a ) What are the functions of lines x
helpOUESTION :
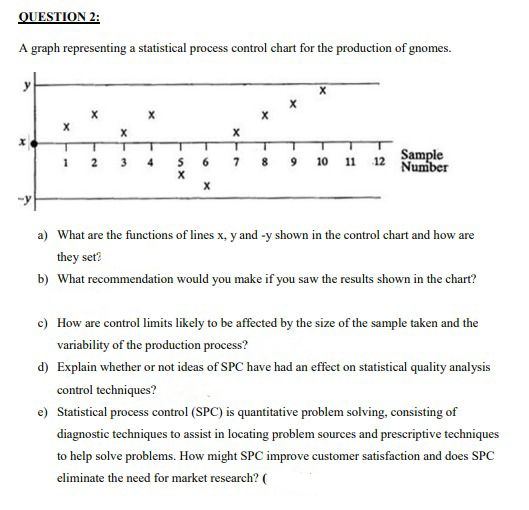
A graph representing a statistical process control chart for the production of gnomes.
a What are the functions of lines and y shown in the control chart and how are
they set?
b What recommendation would you make if you saw the results shown in the chart?
c How are control limits likely to be affected by the size of the sample taken and the
variability of the production process?
d Explain whether or not ideas of SPC have had an effect on statistical quality analysis
control techniques?
e Statistical process control SPC is quantitative problem solving, consisting of
diagnostic techniques to assist in locating problem sources and prescriptive techniques
to help solve problems. How might SPC improve customer satisfaction and does SPC
eliminate the need for market research?
Step by Step Solution
There are 3 Steps involved in it
1 Expert Approved Answer
Step: 1 Unlock

Question Has Been Solved by an Expert!
Get step-by-step solutions from verified subject matter experts
Step: 2 Unlock
Step: 3 Unlock