

Question: HELPPP what are the equations Activity 2: Determining the Densities of Solutions Data Table (3 points) Complete the tables below based on Data Table 2:
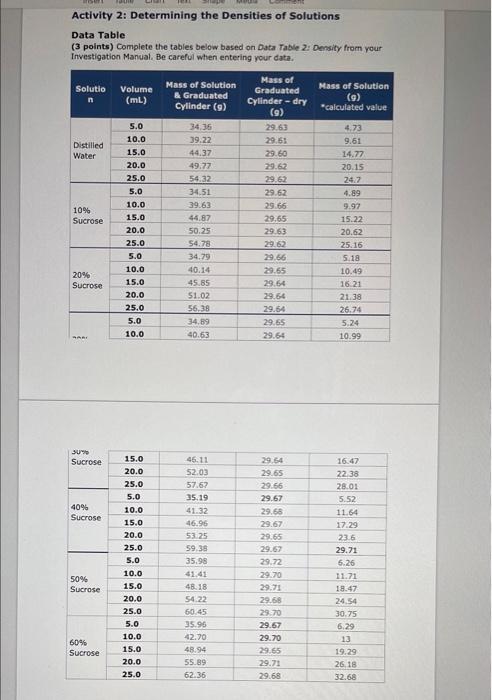
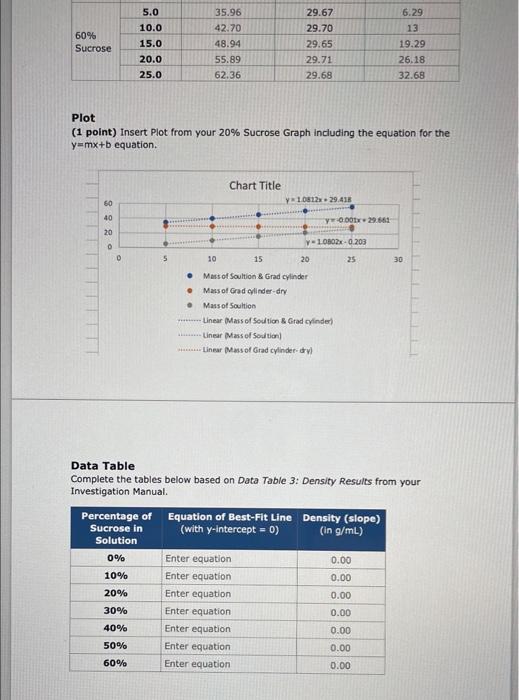
Activity 2: Determining the Densities of Solutions Data Table (3 points) Complete the tables below based on Data Table 2: Density from your Investigation Manual. Be careful when entering your data. Solutio n Volume (ML) Mass of Solution & Graduated Cylinder (9) Mass of Solution (9) *calculated value Distilled Water 5.0 10.0 15.0 20.0 25.0 5.0 34 35 39.22 44.37 49.77 54.32 34.51 39.63 10% Sucrose 10.0 15.0 20.0 25.0 5.0 10.0 15.0 20.0 25.0 Mass of Graduated Cylinder - dry (9) 29.63 29.61 29.60 29.62 29.62 29.62 29.66 29.65 29.63 29.62 29,66 29.65 29.64 29.54 29.54 29.65 29.64 4.73 9.61 14.77 20.15 24.7 4.89 9.97 15.22 20.62 25.16 5.18 10.49 16.21 21.38 26.74 5.24 10.99 50.25 54.78 34.79 40.14 45.85 51.02 56.38 34.89 40.63 20% Sucrose 5.0 10.0 30% Sucrose 4096 Sucrose 15.0 20.0 25.0 5.0 10.0 15.0 20.0 25.0 5.0 10.0 15.0 20.0 25.0 46.11 52.03 57.62 35.19 41.32 46.96 53.25 59.35 35.98 41:41 48.18 54.22 60.45 35.96 42.70 48.94 55.89 62.36 29.54 29.65 29.55 29.67 29.58 29.67 29.65 29.67 29.72 29.70 29.71 29.68 29.70 29.67 29.70 29.65 29.71 29.68 16.47 22:38 28.01 5.52 11.64 17.29 23.6 29.71 5.26 11.71 18.47 24,54 30.75 6,29 13 19.29 26.18 32.68 50% Sucrose 5.0 60% Sucrose 10.0 15.0 20.0 25.0 60% Sucrose 5.0 10.0 15.0 20.0 25.0 35.96 42.70 48.94 55.89 62.36 29.67 29.70 29.65 29.71 29.68 6.29 13 19.29 26.18 32.68 Plot (1 point) Insert Plot from your 20% Sucrose Graph including the equation for the y=mx+b equation. Chart Title 60 10812x29.418 Yox 29.661 40 20 0 Y-10802x0.200 5 10 15 20 25 30 Mass of Soultion & Grad cylinder Mass of Gradcylinder-dry Mass of Soultion Linear Mass of Soution & Grad cylinder Linear Mass of Soution) Linear Mass of Grad cylinder-cyl Data Table Complete the tables below based on Data Table 3: Density Results from your Investigation Manual Percentage of Equation of Best-Fit Line Density (slope) Sucrose in (with y-intercept = 0) (in g/mL) Solution 0% Enter equation 0.00 10% Enter equation 0.00 20% Enter equation 0.00 30% Enter equation 0.00 40% Enter equation 0.00 50% Enter equation 0.00 60% Enter equation 0.00
Step by Step Solution
There are 3 Steps involved in it

Get step-by-step solutions from verified subject matter experts