

Question: Hepl me with this please I use to post this 21 hr ago but none reply. Find Nike's Form 10-K for 2021, for the fiscal
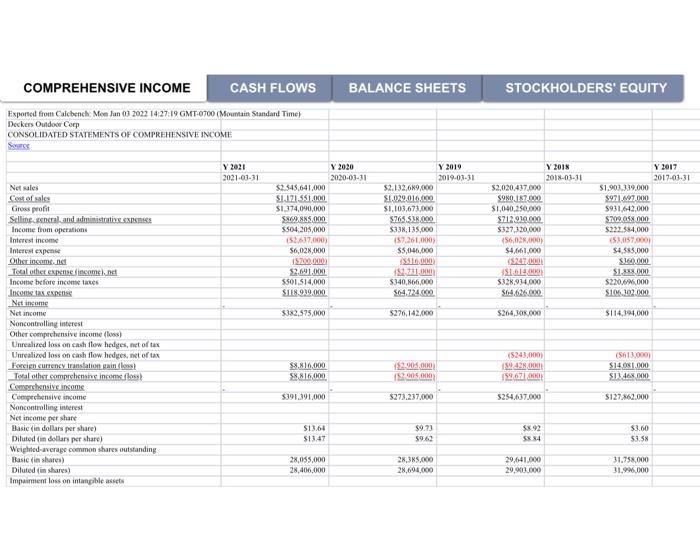
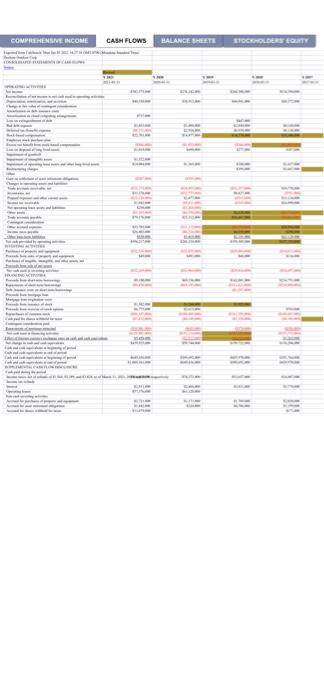
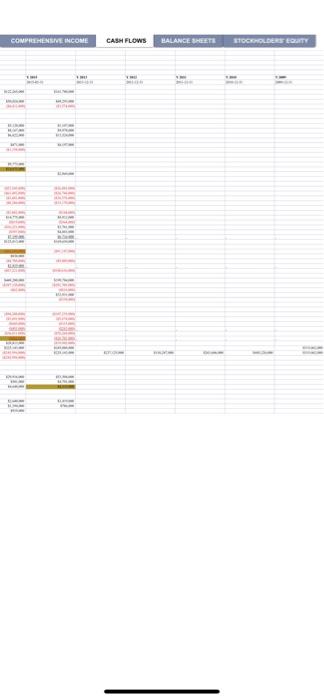
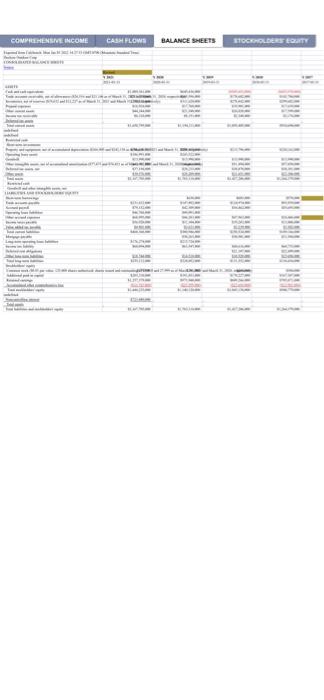
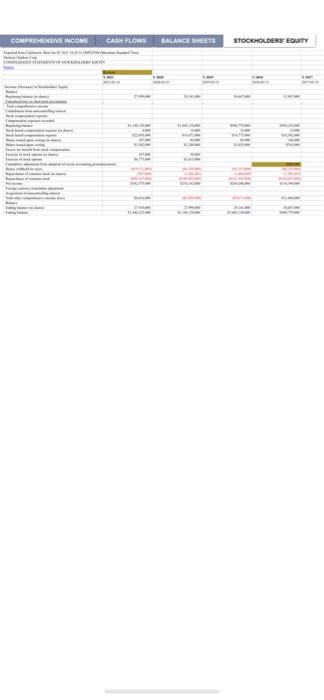
Find Nike's Form 10-K for 2021, for the fiscal year ended May 31, 2021 (nike.com) by scrolling to the bottom and click on Investors under ABOUT NIKE. From the Investors page (investors.nike.com), hover over Investors in the upper left, then click on Annual Reports to find ok PDF). Briefly answer the following questions using the information provided. Complete sentences are not required except where specifically noted. Unless otherwise noted, the relevant information is contained in Item 8,"Financial Statements and Supplementary Data," which begins on page 53. Also, unless otherwise noted, the questions relate to fiscal year 2021. Statement of Cash Flows 4. What was the net change in Nike's cash and cash equivalents during the year? 5. How much did Nike pay in cash dividends during the year? 6. What is Nike's net cash from operating activities? 7. What is Nike's net cash from investing activities? 8. What is Nike's net cash from financing activities? Comparison of Nike and Deckers Outdoor Corporation 9. Which company had higher percentage sales growth from 2020 to 2021? 10. Which company had more profitable sales? Calculate the two company's gross profit margins. 1 11. Which company had a higher income tax rate? Calculate the difference in effective tax rates (.e., income tax expense . pretax income). 12. Which company has more financial risk? Calculate the difference in debt-to-equity ratios (i.e., total debt, total equity). BALANCE SHEETS STOCKHOLDERS' EQUITY COMPREHENSIVE INCOME CASH FLOWS Exported from Calebench: Men Jan 03 2022 14:27:19 GMT-9700 (Mountain Standard Time Deckers Outdoor Corp CONSOLIDATED STATEMENTS OF COMPREHENSIVE INCOME SS Y 2021 2021-03-31 Y 2020 2020-01.31 $2.345.641,000 S1.121 551.000 SI 374,090,000 S5.000 5504.205,000 152617.000 $6,020,000 15000 $2.001.000 $501514,000 $118.919.000 Y 2019 2019-03-31 $2.132,689,000 $1.029.010. $1,103,673,000 $765.538.000 5338,135.000 157.261,000) $5,046,000 SARALA | 2.000 $340,166,000 564.24. Y 2018 2018-03-31 $2,020,437,000 S90.17.000 SI,040,250.000 $21.91000 $327.320,000 56,028,000) $4.661.000 $2.000 5164 5328.934,000 $64.646 Y 2017 2017.03.31 $1.903.339.000 $971.97.000 $931642.000 $709 08 000 $222.384.000 (52,057.000) $4.583.000 SI 000 SIXXX 000 $220,6/1,000 SIM102.000 $382,575,000 5276,142,000 $26405.000 $114,194,000 Net sales Cost of sales Gross profit Selline sncral and administratives Income from operations Interest income Interest expense Other income.net Toral other expedincom net Income before income taxes Income Not income Net income Noncontrolling interest Other comprehensive income (s) Unrealized loss on cash flow hedges, net of tax Unrealized loss on cash flow hedges, net of tax Foreign currency translation painos Total other comprehensihe incomo Cehensive income Compechensive income Noncontrolling interest Not income per share Basic in dollars per share) Diluted in dollars per share) Weighted average common shares outstanding Basic in shares) Diluted in shares) Impairment loss on intangible assets 10.000 S8816.000 200.000 152005 (5243,000 189 19.01 (5613.0001 $14.061.000 SI468 000 $391.391.000 $273.237,000 5254,637.000 $127.862.000 $13.64 S13,47 $9.73 59.62 $8.92 S884 $3.60 53.5 28.055.000 28,406,000 28,365.000 28,694,000 29,641.000 29,933.000 31.758.000 31.9.000 COMPREHENSIVE INCOME CASH FLOWS BALANCE SHEET STOCOLDERS EQUITY COMPREHENSIVE INCOME CASH FLOWS BALANCE SHEETS TOCHOLDERS EQUITY i 11 i COMPREHENSIVE INCOME CASH FLOW BALANCE SHEETS COLEGITY COMPREHENSIVE INCOME CASH FLOW BALANCE SHEETS STOCKHOLDERS EQUITY Find Nike's Form 10-K for 2021, for the fiscal year ended May 31, 2021 (nike.com) by scrolling to the bottom and click on Investors under ABOUT NIKE. From the Investors page (investors.nike.com), hover over Investors in the upper left, then click on Annual Reports to find ok PDF). Briefly answer the following questions using the information provided. Complete sentences are not required except where specifically noted. Unless otherwise noted, the relevant information is contained in Item 8,"Financial Statements and Supplementary Data," which begins on page 53. Also, unless otherwise noted, the questions relate to fiscal year 2021. Statement of Cash Flows 4. What was the net change in Nike's cash and cash equivalents during the year? 5. How much did Nike pay in cash dividends during the year? 6. What is Nike's net cash from operating activities? 7. What is Nike's net cash from investing activities? 8. What is Nike's net cash from financing activities? Comparison of Nike and Deckers Outdoor Corporation 9. Which company had higher percentage sales growth from 2020 to 2021? 10. Which company had more profitable sales? Calculate the two company's gross profit margins. 1 11. Which company had a higher income tax rate? Calculate the difference in effective tax rates (.e., income tax expense . pretax income). 12. Which company has more financial risk? Calculate the difference in debt-to-equity ratios (i.e., total debt, total equity). BALANCE SHEETS STOCKHOLDERS' EQUITY COMPREHENSIVE INCOME CASH FLOWS Exported from Calebench: Men Jan 03 2022 14:27:19 GMT-9700 (Mountain Standard Time Deckers Outdoor Corp CONSOLIDATED STATEMENTS OF COMPREHENSIVE INCOME SS Y 2021 2021-03-31 Y 2020 2020-01.31 $2.345.641,000 S1.121 551.000 SI 374,090,000 S5.000 5504.205,000 152617.000 $6,020,000 15000 $2.001.000 $501514,000 $118.919.000 Y 2019 2019-03-31 $2.132,689,000 $1.029.010. $1,103,673,000 $765.538.000 5338,135.000 157.261,000) $5,046,000 SARALA | 2.000 $340,166,000 564.24. Y 2018 2018-03-31 $2,020,437,000 S90.17.000 SI,040,250.000 $21.91000 $327.320,000 56,028,000) $4.661.000 $2.000 5164 5328.934,000 $64.646 Y 2017 2017.03.31 $1.903.339.000 $971.97.000 $931642.000 $709 08 000 $222.384.000 (52,057.000) $4.583.000 SI 000 SIXXX 000 $220,6/1,000 SIM102.000 $382,575,000 5276,142,000 $26405.000 $114,194,000 Net sales Cost of sales Gross profit Selline sncral and administratives Income from operations Interest income Interest expense Other income.net Toral other expedincom net Income before income taxes Income Not income Net income Noncontrolling interest Other comprehensive income (s) Unrealized loss on cash flow hedges, net of tax Unrealized loss on cash flow hedges, net of tax Foreign currency translation painos Total other comprehensihe incomo Cehensive income Compechensive income Noncontrolling interest Not income per share Basic in dollars per share) Diluted in dollars per share) Weighted average common shares outstanding Basic in shares) Diluted in shares) Impairment loss on intangible assets 10.000 S8816.000 200.000 152005 (5243,000 189 19.01 (5613.0001 $14.061.000 SI468 000 $391.391.000 $273.237,000 5254,637.000 $127.862.000 $13.64 S13,47 $9.73 59.62 $8.92 S884 $3.60 53.5 28.055.000 28,406,000 28,365.000 28,694,000 29,641.000 29,933.000 31.758.000 31.9.000 COMPREHENSIVE INCOME CASH FLOWS BALANCE SHEET STOCOLDERS EQUITY COMPREHENSIVE INCOME CASH FLOWS BALANCE SHEETS TOCHOLDERS EQUITY i 11 i COMPREHENSIVE INCOME CASH FLOW BALANCE SHEETS COLEGITY COMPREHENSIVE INCOME CASH FLOW BALANCE SHEETS STOCKHOLDERS EQUITY
Step by Step Solution
There are 3 Steps involved in it

Get step-by-step solutions from verified subject matter experts