

Question: her strategic allocation? Dem 4. Consider the annual returns produced by two different active equity portfolio managers (A and B) as well as those to
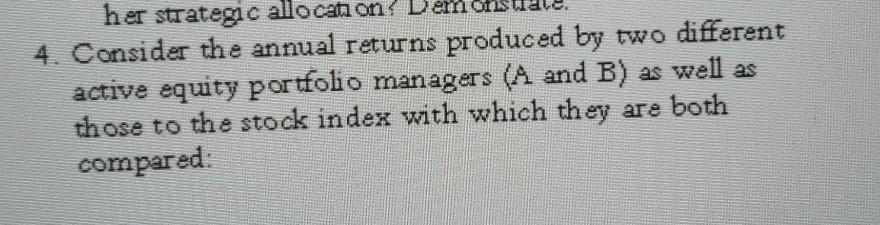
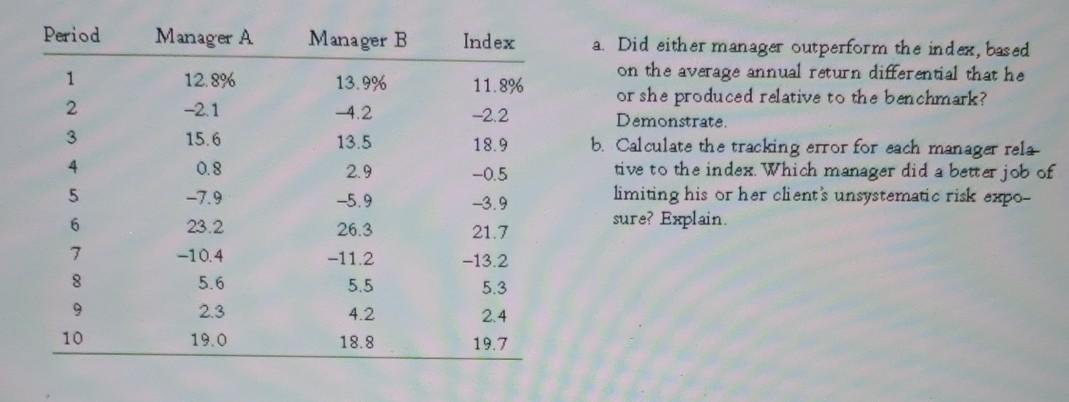
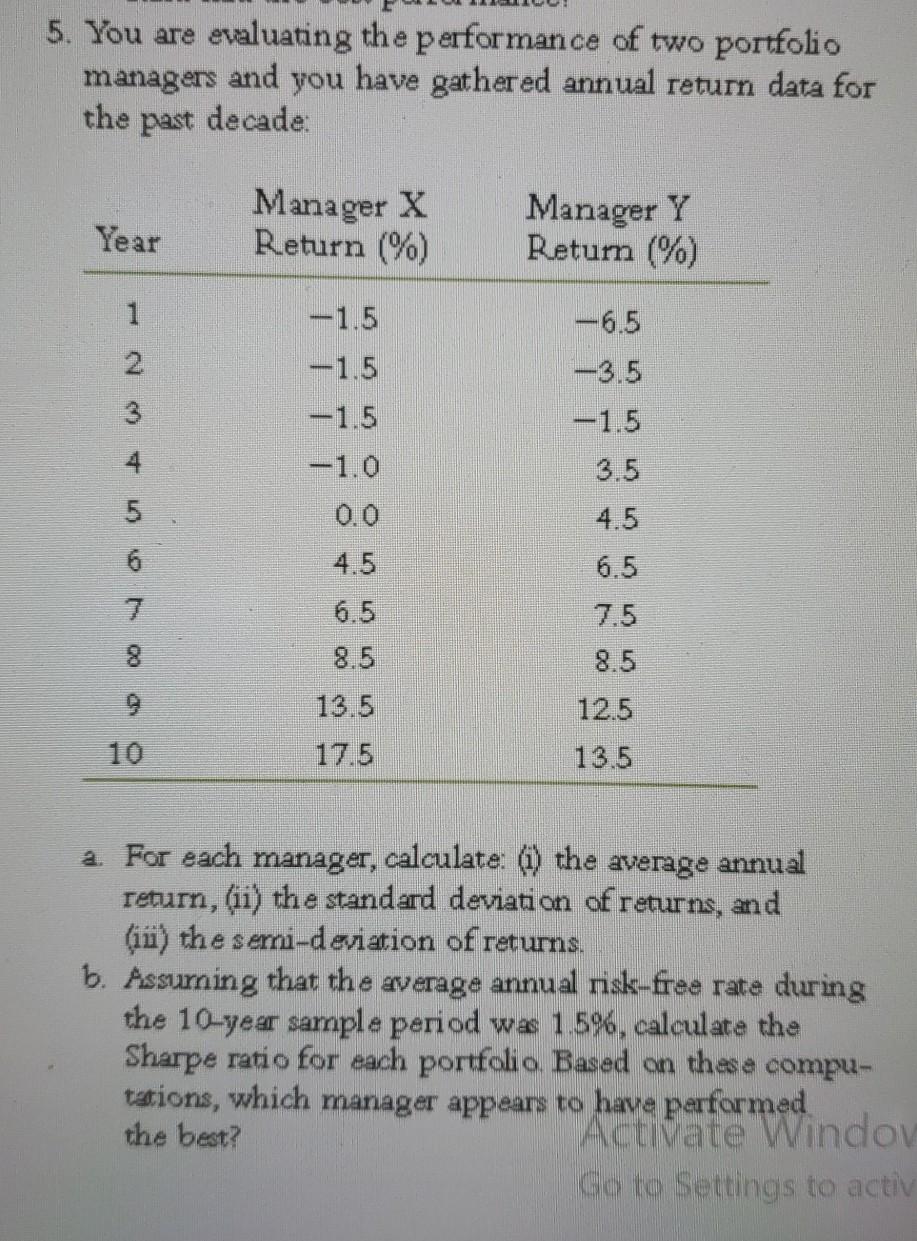
her strategic allocation? Dem 4. Consider the annual returns produced by two different active equity portfolio managers (A and B) as well as those to the stock index with which they are both compared: Period Manager A Manager B Index 1 2 12.8% -2.1 15.6 0.8 3 13.9% 4.2 13.5 2.9 -5.9 26.3 11.8% -2.2 18.9 -0.5 a. Did either manager outperform the index, based on the average annual return differential that he or she produced relative to the benchmark? Demonstrate b. Calculate the tracking error for each manager rela tive to the index. Which manager did a better job of limiting his or her client's unsystematic risk expo- sure? Explain 4 5 6 7. 23.2 -10.4 5.6 -11.2 5.5 8 21.7 -13.2 5.3 2.4 19.7 9 2.3 4.2 18.8 10 19.0 5. You are evaluating the performance of two portfolio managers and you have gathered annual return data for the past decade Year Manager X Return (%) Manager Y Retum (%) 1 -1.5 6.5 -3.5 -1.5 -1.5 3 -1.5 4 -1.0 3.5 5 4.5 6 6.5 7 4.5 6.5 8.5 7.5 8.5 8 13.5 12.5 13.5 17.5 a. For each manager, calculate: (1) the average annual return, (ii) the standard deviation of returns, and (ii) the semi-deviation of returns. b. Assurning that the average annual risk-free rate during the 10-year sample period wa 1.5%, calculate the Sharpe ratio for each portfolio Based on these compu- tations, which manager appears to have performed the best? Acuvate Window Go to Settings to activ her strategic allocation? Dem 4. Consider the annual returns produced by two different active equity portfolio managers (A and B) as well as those to the stock index with which they are both compared: Period Manager A Manager B Index 1 2 12.8% -2.1 15.6 0.8 3 13.9% 4.2 13.5 2.9 -5.9 26.3 11.8% -2.2 18.9 -0.5 a. Did either manager outperform the index, based on the average annual return differential that he or she produced relative to the benchmark? Demonstrate b. Calculate the tracking error for each manager rela tive to the index. Which manager did a better job of limiting his or her client's unsystematic risk expo- sure? Explain 4 5 6 7. 23.2 -10.4 5.6 -11.2 5.5 8 21.7 -13.2 5.3 2.4 19.7 9 2.3 4.2 18.8 10 19.0 5. You are evaluating the performance of two portfolio managers and you have gathered annual return data for the past decade Year Manager X Return (%) Manager Y Retum (%) 1 -1.5 6.5 -3.5 -1.5 -1.5 3 -1.5 4 -1.0 3.5 5 4.5 6 6.5 7 4.5 6.5 8.5 7.5 8.5 8 13.5 12.5 13.5 17.5 a. For each manager, calculate: (1) the average annual return, (ii) the standard deviation of returns, and (ii) the semi-deviation of returns. b. Assurning that the average annual risk-free rate during the 10-year sample period wa 1.5%, calculate the Sharpe ratio for each portfolio Based on these compu- tations, which manager appears to have performed the best? Acuvate Window Go to Settings to activ
Step by Step Solution
There are 3 Steps involved in it

Get step-by-step solutions from verified subject matter experts