

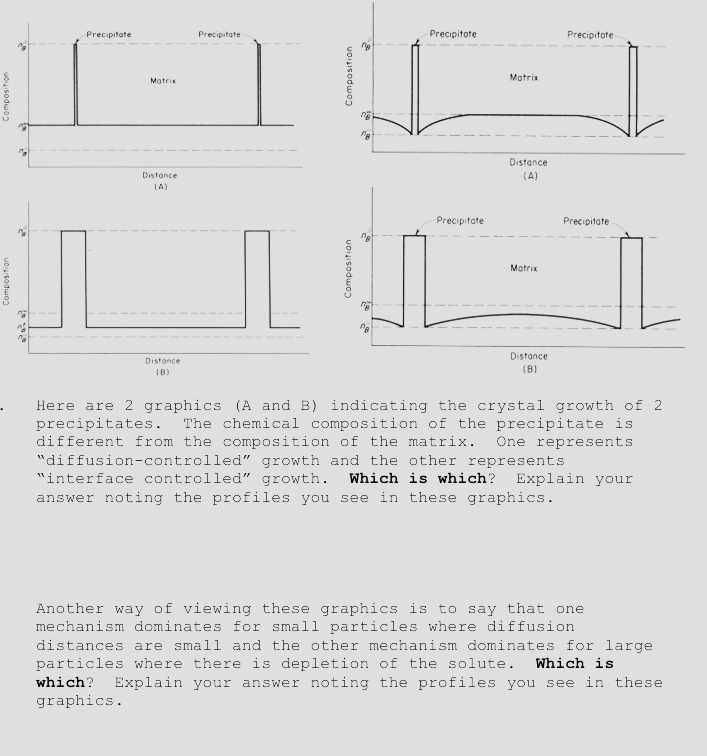
Question: Here are 2 graphics ( A and B ) indicating the crystal growth of 2 precipitates. The chemical composition of the precipitate is different from
Here are graphics A and indicating the crystal growth of
precipitates. The chemical composition of the precipitate is
different from the composition of the matrix. One represents
"diffusioncontrolled" growth and the other represents
"interface controlled" growth. Which is which? Explain your
answer noting the profiles you see in these graphics.
Another way of viewing these graphics is to say that one
mechanism dominates for small particles where diffusion
distances are small and the other mechanism dominates for large
particles where there is depletion of the solute. Which is
which? Explain your answer noting the profiles you see in these
graphics.
Step by Step Solution
There are 3 Steps involved in it
1 Expert Approved Answer
Step: 1 Unlock

Question Has Been Solved by an Expert!
Get step-by-step solutions from verified subject matter experts
Step: 2 Unlock
Step: 3 Unlock