Question: Here are a quote and a partial data table from the U.S. Bureau of Labor Statistics : In 2019, 82.3 million workers age 16 and
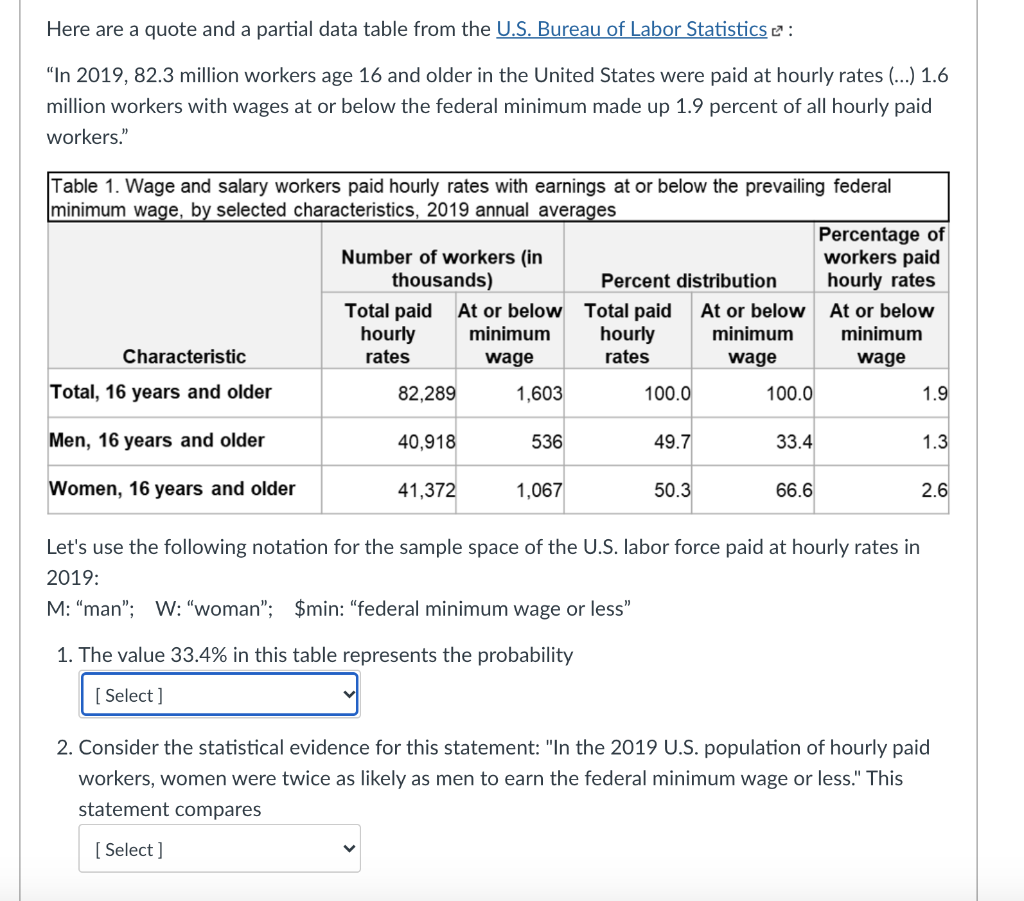
Here are a quote and a partial data table from the U.S. Bureau of Labor Statistics : "In 2019, 82.3 million workers age 16 and older in the United States were paid at hourly rates (...) 1.6 million workers with wages at or below the federal minimum made up 1.9 percent of all hourly paid workers." Table 1. Wage and salary workers paid hourly rates with earnings at or below the prevailing federal minimum wage, by selected characteristics, 2019 annual averages Percentage of Number of workers (in workers paid thousands) Percent distribution hourly rates Total paid At or below Total paid At or below At or below hourly minimum hourly minimum minimum Characteristic rates wage rates wage Total, 16 years and older 82,289 1,603 100.0 100.0 1.9 Wage Men, 16 years and older 40,918 536 49.7 33.4 1.3 Women, 16 years and older 41,372 1,067 50.3 66.6 2.6 Let's use the following notation for the sample space of the U.S. labor force paid at hourly rates in 2019: M: "man"; W: "woman"; $min: "federal minimum wage or less" 1. The value 33.4% in this table represents the probability [ Select ] 2. Consider the statistical evidence for this statement: "In the 2019 U.S. population of hourly paid workers, women were twice as likely as men to earn the federal minimum wage or less." This statement compares [ Select] Here are a quote and a partial data table from the U.S. Bureau of Labor Statistics : "In 2019, 82.3 million workers age 16 and older in the United States were paid at hourly rates (...) 1.6 million workers with wages at or below the federal minimum made up 1.9 percent of all hourly paid workers." Table 1. Wage and salary workers paid hourly rates with earnings at or below the prevailing federal minimum wage, by selected characteristics, 2019 annual averages Percentage of Number of workers (in workers paid thousands) Percent distribution hourly rates Total paid At or below Total paid At or below At or below hourly minimum hourly minimum minimum Characteristic rates wage rates wage Total, 16 years and older 82,289 1,603 100.0 100.0 1.9 Wage Men, 16 years and older 40,918 536 49.7 33.4 1.3 Women, 16 years and older 41,372 1,067 50.3 66.6 2.6 Let's use the following notation for the sample space of the U.S. labor force paid at hourly rates in 2019: M: "man"; W: "woman"; $min: "federal minimum wage or less" 1. The value 33.4% in this table represents the probability [ Select ] 2. Consider the statistical evidence for this statement: "In the 2019 U.S. population of hourly paid workers, women were twice as likely as men to earn the federal minimum wage or less." This statement compares [ Select]


