

Question: Here are comparative financial statement data for Crane Company and Mary Company, two competitors. All data are as of December 31, 2022, and December
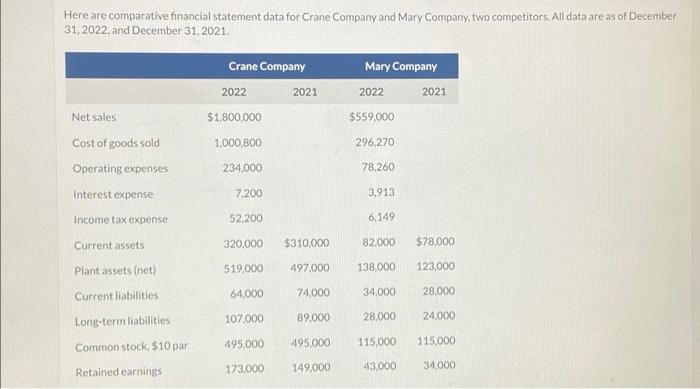
Here are comparative financial statement data for Crane Company and Mary Company, two competitors. All data are as of December 31, 2022, and December 31, 2021. Crane Company Mary Company 2022 2021 2022 2021 Net sales $1,800,000 $559,000 Cost of goods sold 1,000,800 296,270 Operating expenses 234,000 78.260 Interest expense 7.200 3,913 Income tax expense 52.200 6,149 Current assets 320,000 $310,000 82,000 $78,000 Plant assets (net) 519,000 497,000 138,000 123,000) Current liabilities 64,000 74,000 34,000 28,000 Long-term liabilities 107,000 89,000 28,000 24,000 Common stock, $10 par 495.000 495,000 115,000 115,000 Retained earnings 173,000 149,000 43,000 34,000
Step by Step Solution
There are 3 Steps involved in it

Get step-by-step solutions from verified subject matter experts