

Question: Here are comparative financial statement data for Sandhill Company and Wildhorse Company, two competitors. All data are as of December 31, 2022, and December 31,
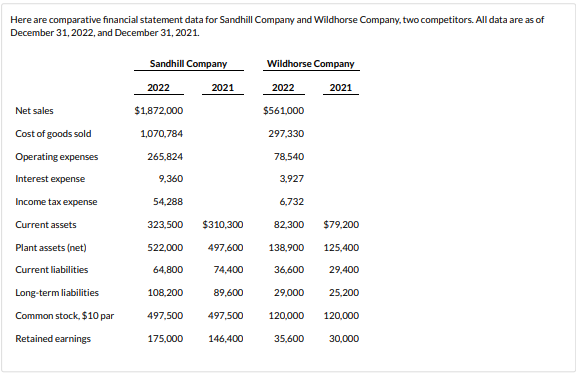
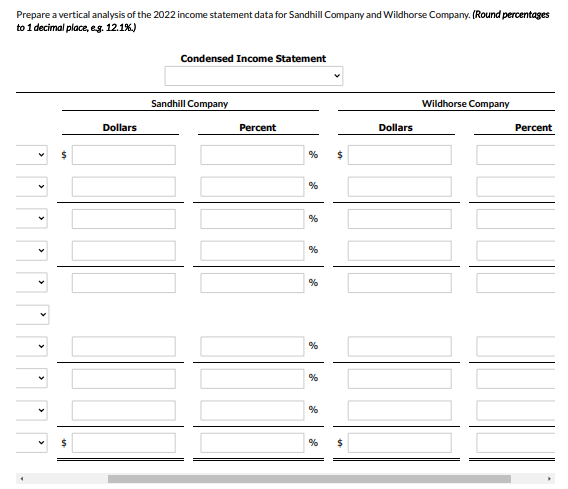
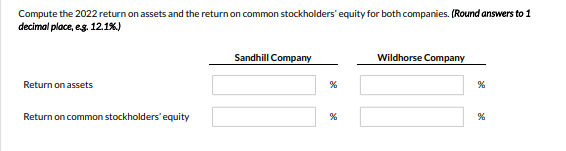
Here are comparative financial statement data for Sandhill Company and Wildhorse Company, two competitors. All data are as of December 31, 2022, and December 31, 2021. Sandhill Company Wildhorse Company 2022 2021 2022 2021 Net sales $1,872,000 $561,000 1,070.784 297,330 265.824 78.540 9,360 3.927 54,288 6,732 323.500 $310,300 82.300 $79,200 Cost of goods sold Operating expenses Interest expense Income tax expense Current assets Plant assets (net) Current liabilities Long-term liabilities Common stock, $10 par Retained earnings 522,000 497,600 138,900 125,400 64,800 74.400 36,600 29,400 108,200 89,600 29,000 25,200 497.500 497,500 120,000 120,000 175,000 146,400 35,600 30,000 Prepare a vertical analysis of the 2022 income statement data for Sandhill Company and Wildhorse Company. (Round percentages to 1 decimal place, eg. 12.1%.) Condensed Income Statement v Sandhill Company Wildhorse Company Dollars Percent Dollars Percent % $ % % % % % % % % Compute the 2022 return on assets and the return on common stockholders' equity for both companies. (Round answers to 1 decimal place, eg. 12.1%.) Sandhill Company Wildhorse Company Return on assets % % Return on common stockholders' equity % %
Step by Step Solution
There are 3 Steps involved in it

Get step-by-step solutions from verified subject matter experts