

Question: Here are comparative statement data for Oriole Company and Ivanhoe Compan Net sales Cost of goods sold Operating expenses Interest expense Income tax expense Oriole
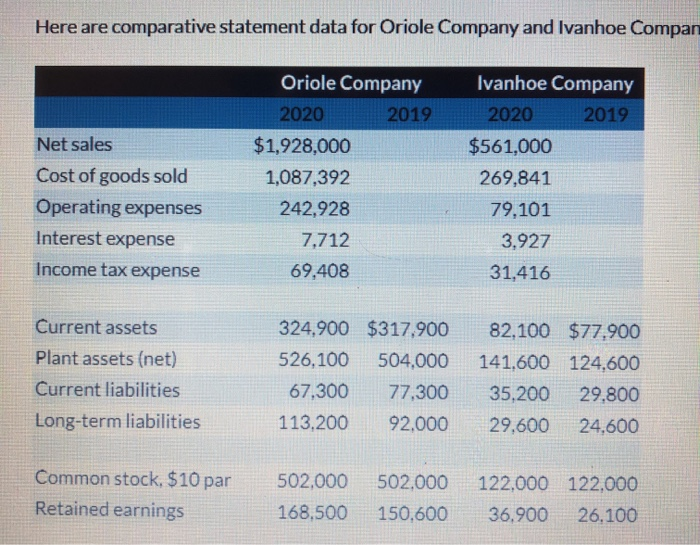
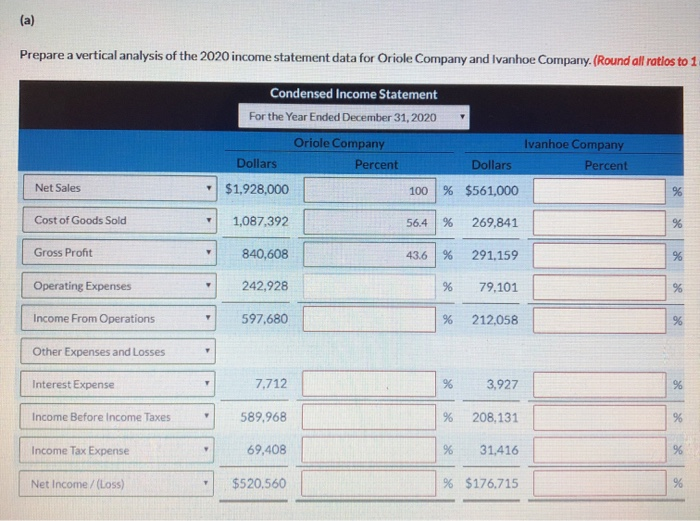
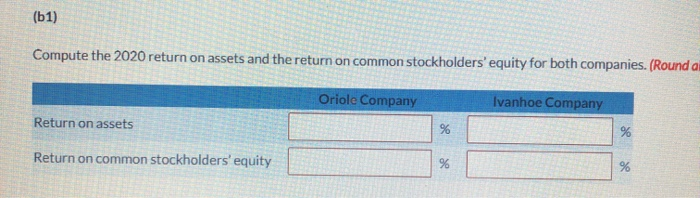
Here are comparative statement data for Oriole Company and Ivanhoe Compan Net sales Cost of goods sold Operating expenses Interest expense Income tax expense Oriole Company 2020 2019 $1,928,000 1,087,392 242,928 7,712 69,408 Ivanhoe Company 2020 2019 $561,000 269,841 79,101 3,927 31,416 Current assets Plant assets (net) Current liabilities Long-term liabilities 324,900 $317,900 526,100 504,000 67,300 77,300 113,200 92,000 82,100 $77,900 141.600 124,600 35,200 29,800 29,600 24.600 Common stock. $10 par Retained earnings 502,000 168,500 502,000 150,600 122,000 122,000 36,900 26,100 Prepare a vertical analysis of the 2020 income statement data for Oriole Company and Ivanhoe Company. (Round all ratlos to 1 Condensed Income Statement For the Year Ended December 31, 2020 Oriole Company Ivanhoe Company Dollars Percent Dollars Percent $1,928,000 100 % $561,000 Net Sales Cost of Goods Sold 1,087,392 56.4 % 269,841 Gross Profit 840,608 43.6 % 291.159 Operating Expenses 242,928 79.101 Income From Operations 597,680 % 212,058 Other Expenses and Losses Interest Expense 7.712 3.927 Income Before Income Taxes 589.968 % 208,131 Income Tax Expense 69,408 % 31,416 Net Income /(Loss) $520,560 % $176.715 (61) Compute the 2020 return on assets and the return on common stockholders' equity for both companies. (Round a Oriole Company Ivanhoe Company Return on assets Return on common stockholders' equity
Step by Step Solution
There are 3 Steps involved in it

Get step-by-step solutions from verified subject matter experts