

Question: Here are comparative statement data for Pharoah Company and Cullumber Company, two competitors. All balance sheet data are as of December 31,2017, and December 31,2016
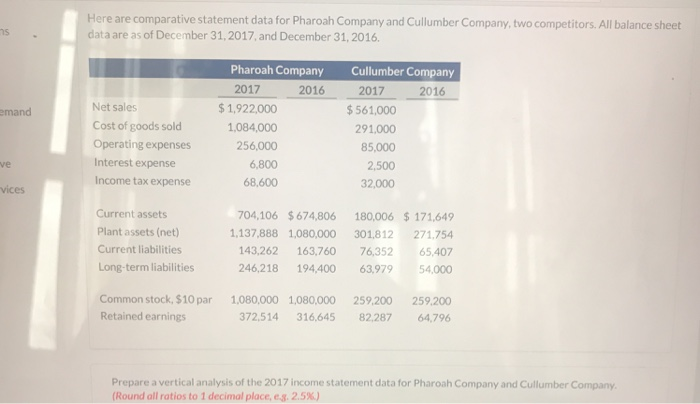
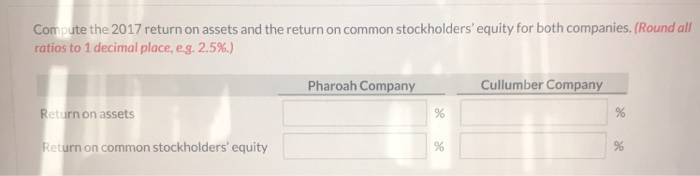
Here are comparative statement data for Pharoah Company and Cullumber Company, two competitors. All balance sheet data are as of December 31,2017, and December 31,2016 hs Pharoah Company 2017 Cullumber Company 2016 2017 2016 Net sales Cost of goods sold Operating expenses Interest expense Income tax expense $ 1,922,000 1,084,000 $561,000 291,000 85,000 2,500 32,000 emand 256,000 6,800 68,600 ve vices Current assets Plant assets (net) Current liabilities Long-term liabilities 704,106 $674,806 180,006 $171,649 1,137,888 1,080,000 301,812 271.754 143,262 163,760 76,352 65,407 246,218 194,400 63,97954,000 Common stock, $10 par1,080,000 Retained earnings 259.200259.200 372,514316,645 82.287 64796 1,080,000 Prepare a vertical analysis of the 2017 income statement data for Pharoah Company and Cullumber Company (Round all ratios to 1 decimal place, eg 2.5%) Compute the 2017 return on assets and the return on common stockholders' equity for both companies. (Round all ratios to 1 decimal place, eg. 2.5%) Pharoah Company Cullumber Company eturn on assets Return on common stockholders' equity
Step by Step Solution
There are 3 Steps involved in it

Get step-by-step solutions from verified subject matter experts