Question: HERE ARE THE CASE QUESTIONS: Based on Table 5-14 Annual demand at CoolWipes and Table 5-15 Transportation costs per unit, without using Excel Solver, can
HERE ARE THE CASE QUESTIONS:
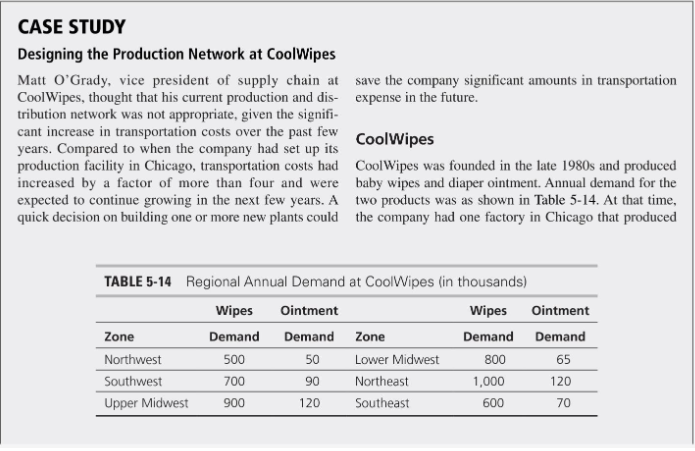
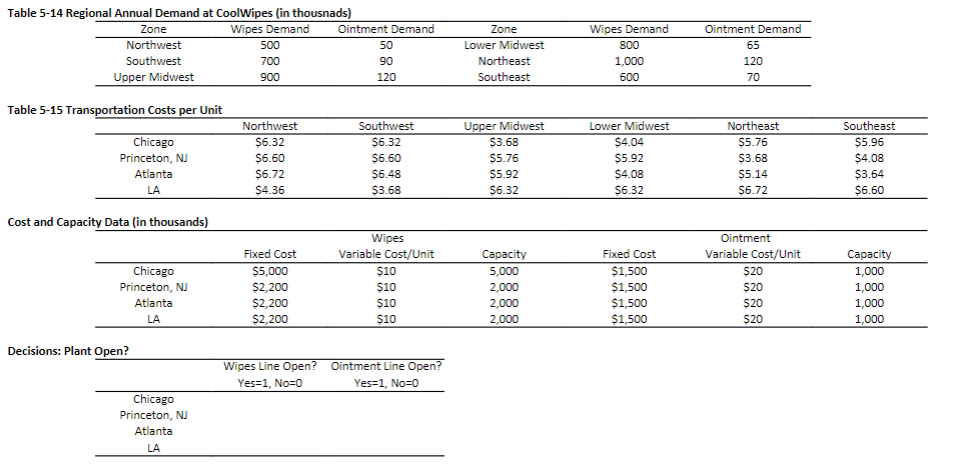
- Based on Table 5-14 Annual demand at CoolWipes and Table 5-15 Transportation costs per unit, without using Excel Solver, can you recommend in what cities should the new plant(s) be built for wipes or ointment? Please explain your reasons.
- What is the annual cost, including fixed costs, variable costs, and transportation costs, of serving the entire nation from Chicago?
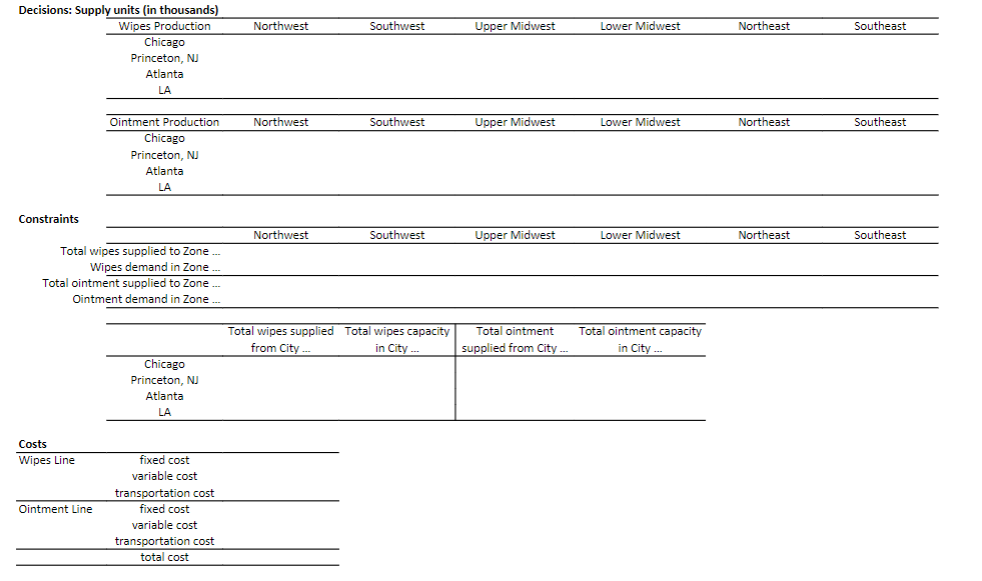
- To minimize the annual cost, in what cities should the plant(s) be built and what product lines should be included? Assume that the Chicago plant will be maintained at its current capacity.
- What is the minimal annual cost?
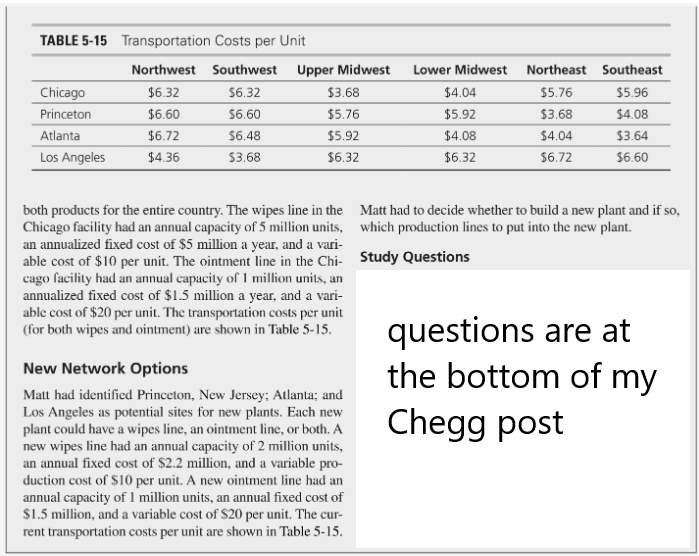
CASE STUDY Designing the Production Network at Cool Wipes Matt O'Grady, vice president of supply chain at save the company significant amounts in transportation CoolWipes, thought that his current production and dis- expense in the future. tribution network was not appropriate, given the signifi- cant increase in transportation costs over the past few Cool Wipes years. Compared to when the company had set up its production facility in Chicago, transportation costs had Cool Wipes was founded in the late 1980s and produced increased by a factor of more than four and were baby wipes and diaper ointment. Annual demand for the expected to continue growing in the next few years. A two products was as shown in Table 5-14. At that time, quick decision on building one or more new plants could the company had one factory in Chicago that produced TABLE 5-14 Regional Annual Demand at Cool Wipes (in thousands) Wipes Ointment Wipes Ointment Zone Demand Demand Zone Demand Demand Northwest 50 Lower Midwest 800 65 Southwest 700 90 Northeast 1,000 120 Upper Midwest 120 Southeast 600 70 500 900 TABLE 5-15 Transportation Costs per Unit Chicago Princeton Atlanta Los Angeles Northwest Southwest Upper Midwest $6.32 $6.32 $3.68 $6.60 $6.60 $5.76 $6.72 $6.48 $5.92 $4.36 $3.68 $6.32 Lower Midwest $4.04 $5.92 $4.08 $6.32 Northeast Southeast $5.76 $5.96 $3.68 $4.08 $4.04 $3.64 $6.72 $6.60 both products for the entire country. The wipes line in the Matt had to decide whether to build a new plant and if so, Chicago facility had an annual capacity of 5 million units, which production lines to put into the new plant. an annualized fixed cost of $5 million a year, and a vari- able cost of $10 per unit. The ointment line in the Chi- Study Questions cago facility had an annual capacity of 1 million units, an annualized fixed cost of $1.5 million a year, and a vari- able cost of $20 per unit. The transportation costs per unit (for both wipes and ointment) are shown in Table 5-15. questions are at the bottom of my Chegg post New Network Options Matt had identified Princeton, New Jersey; Atlanta; and Los Angeles as potential sites for new plants. Each new plant could have a wipes line, an ointment line, or both. A new wipes line had an annual capacity of 2 million units, an annual fixed cost of $2.2 million, and a variable pro- duction cost of $10 per unit. A new ointment line had an annual capacity of 1 million units, an annual fixed cost of $1.5 million, and a variable cost of $20 per unit. The cur- rent transportation costs per unit are shown in Table 5-15. Table 5-14 Regional Annual Demand at Cool Wipes (in thousnads) Zone Wipes Demand Ointment Demand Northwest 500 50 Southwest 700 90 Upper Midwest 900 120 Zone Lower Midwest Northeast Southeast Wipes Demand 800 1,000 600 Ointment Demand 65 120 70 Table 5-15 Transportation Costs per Unit Chicago Princeton, NJ Atlanta LA Northwest $6.32 $6.60 $6.72 $4.36 Southwest $6.32 $6.60 S6.48 S3.68 Upper Midwest $3.68 $5.76 $5.92 $6.32 Lower Midwest $4.04 $5.92 $4.08 $6.32 Northeast $5.76 $3.68 $5.14 $6.72 Southeast $5.96 $4.08 $3.64 $6.60 Cost and Capacity Data (in thousands) Chicago Princeton, NJ Atlanta LA Fixed Cost $5,000 $2,200 $2,200 $2,200 $ Wipes Variable Cost/Unit S10 $10 $ S10 $10 Capacity 5,000 2,000 2,000 2,000 Fixed Cost $1,500 $1,500 $1,500 $ $1,500 Ointment Variable Cost/Unit $20 $20 $20 $20 Capacity 1,000 1,000 1,000 1,000 Decisions: Plant Open? Wipes Line Open? Ointment Line Open? Yes=1, No=0 Yes=1, No=0 Chicago Princeton, NJ Atlanta LA Northwest Southwest Upper Midwest Lower Midwest Northeast Southeast Decisions: Supply units (in thousands) Wipes Production Chicago Princeton, NJ Atlanta LA Northwest Southwest Upper Midwest Lower Midwest Northeast Southeast Ointment Production Chicago Princeton, NJ Atlanta LA Constraints Northwest Southwest Upper Midwest Lower Midwest Northeast Southeast Total wipes supplied to Zone Wipes demand in Zone Total ointment supplied to Zone Ointment demand in Zone ... Total wipes supplied Total wipes capacity from City in City Total ointment supplied from City Total ointment capacity in City Chicago Princeton, NJ Atlanta LA Costs Wipes Line Ointment Line fixed cost variable cost transportation cost fixed cost variable cost transportation cost total cost


