Question: Here are two companies: SONY CORP and MICROSOFT CORP. Construct an industry analysis. In the industry analysis, be sure to include industry description, industry performance,
"Here are two companies: SONY CORP and MICROSOFT CORP. Construct an industry analysis. In the industry analysis, be sure to include industry description, industry performance, industry outlook, major companies. Your discussion should be supported by key statistics. You also need to include COVID impact on the industry. Hint: Since Sony is not a direct competitor to Microsoft use the respective industry data provided for the SONY analysis"
SONY CORP:
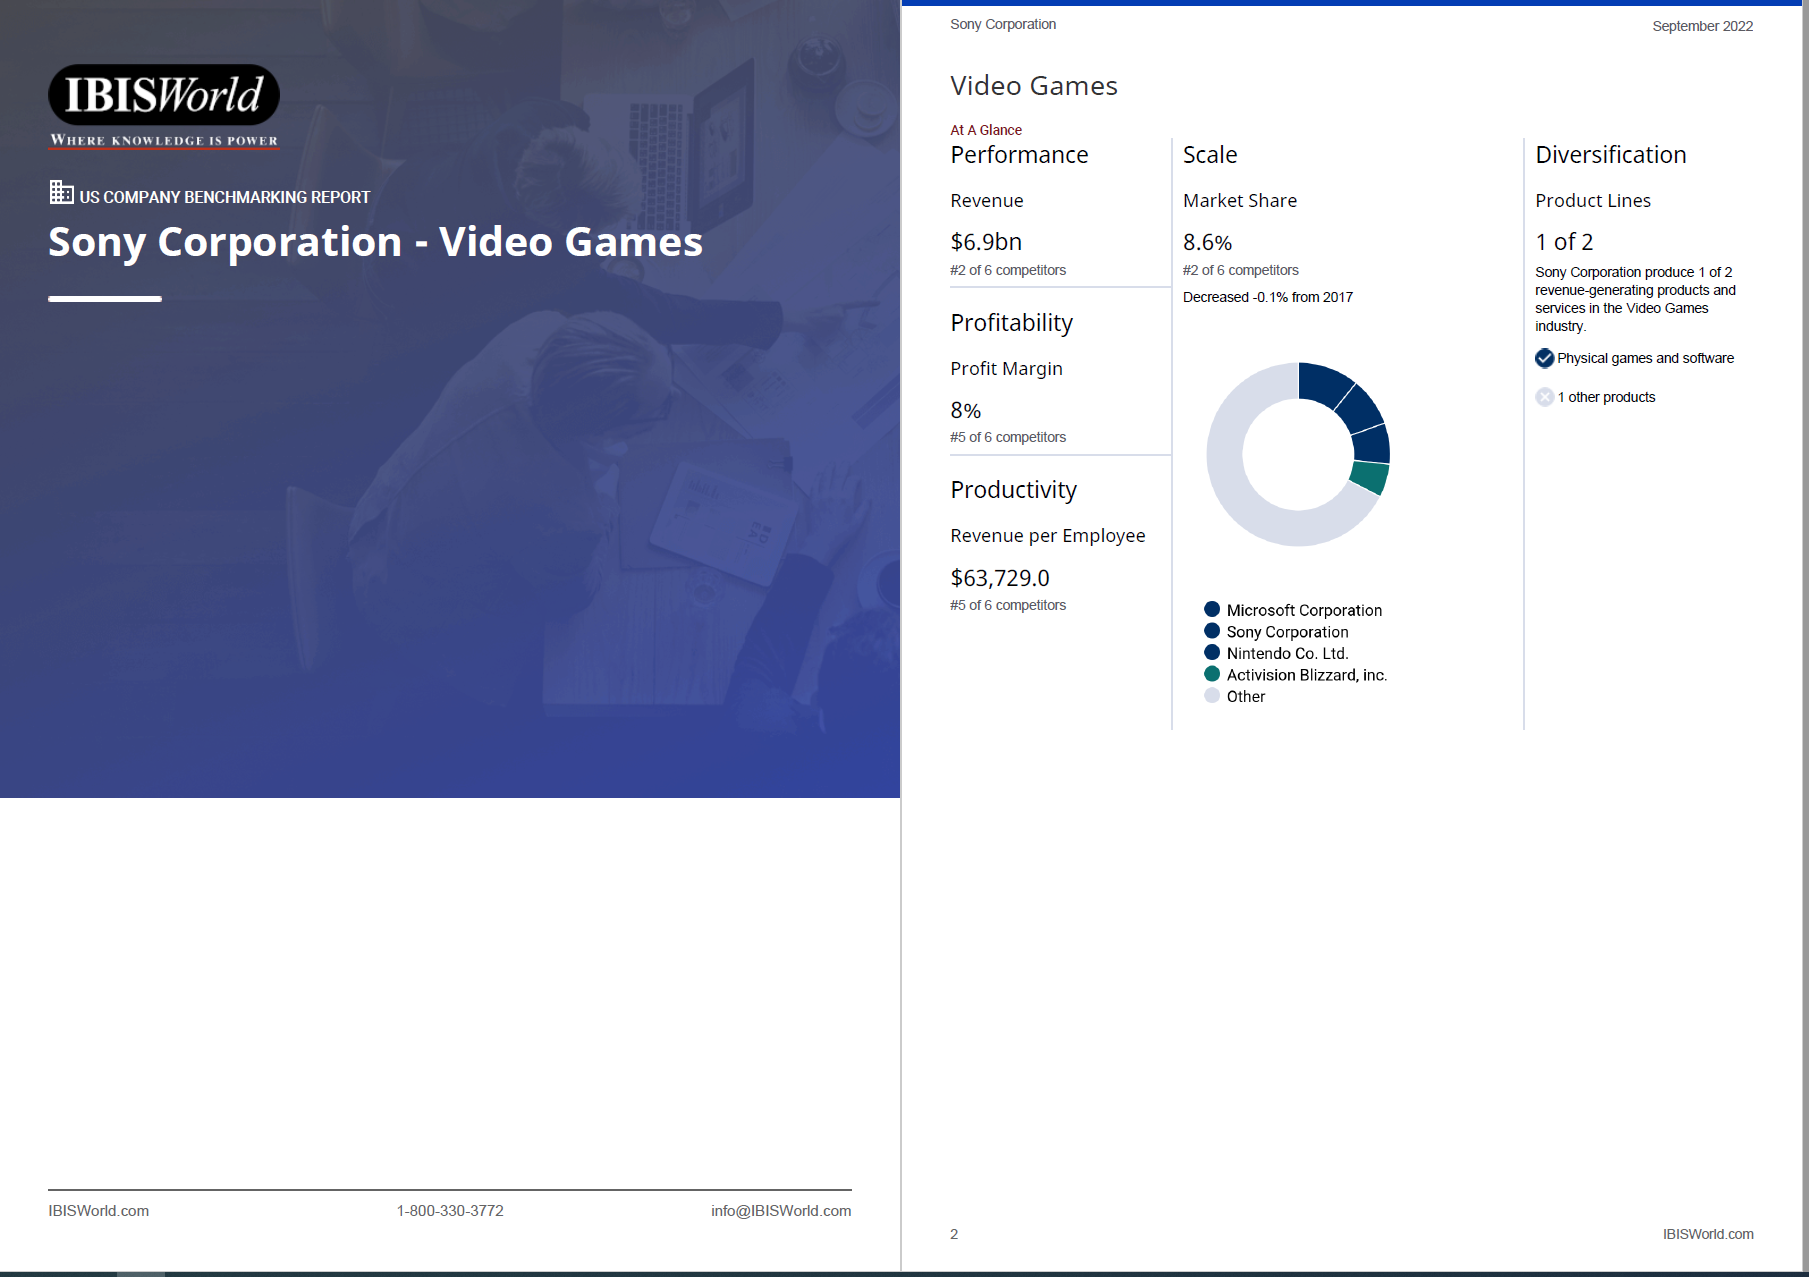
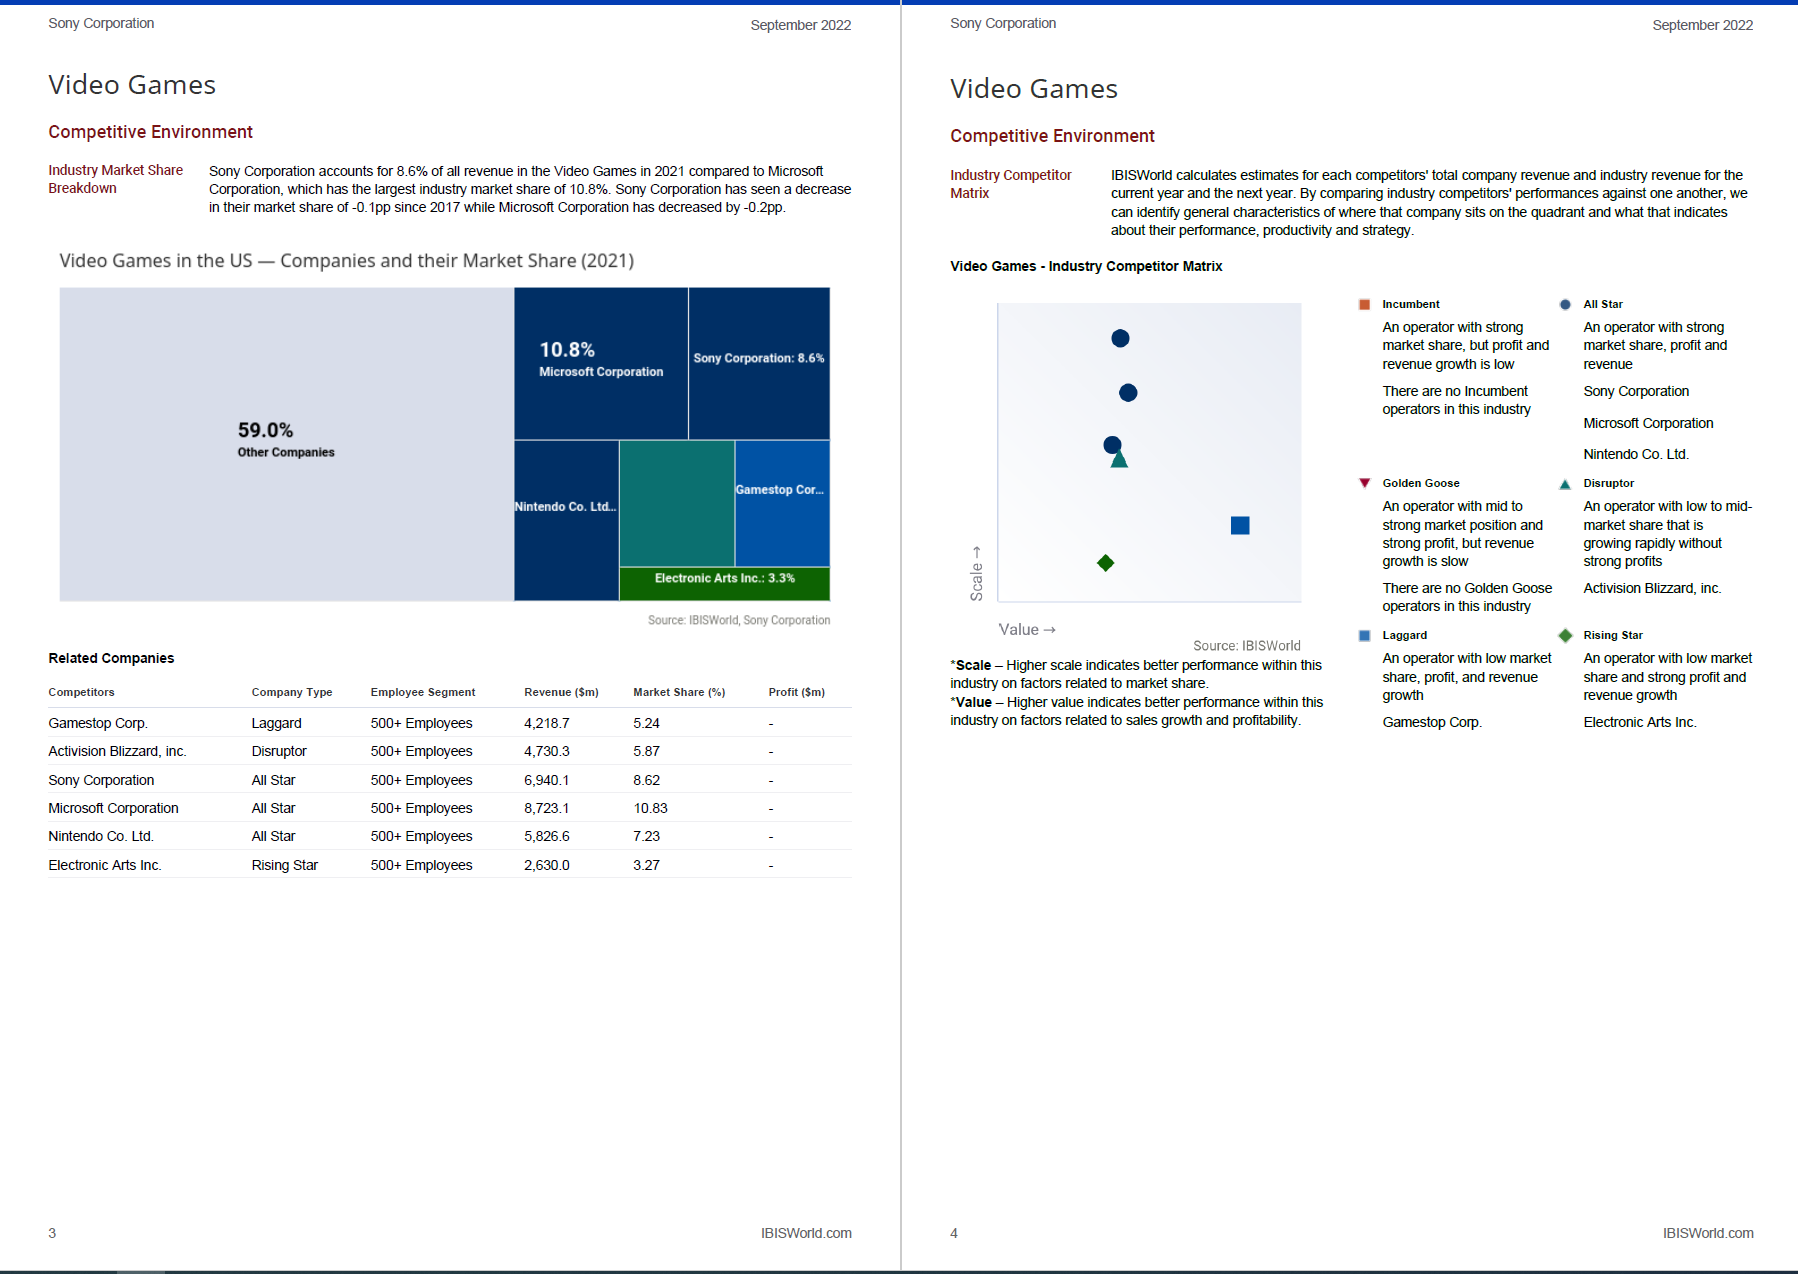
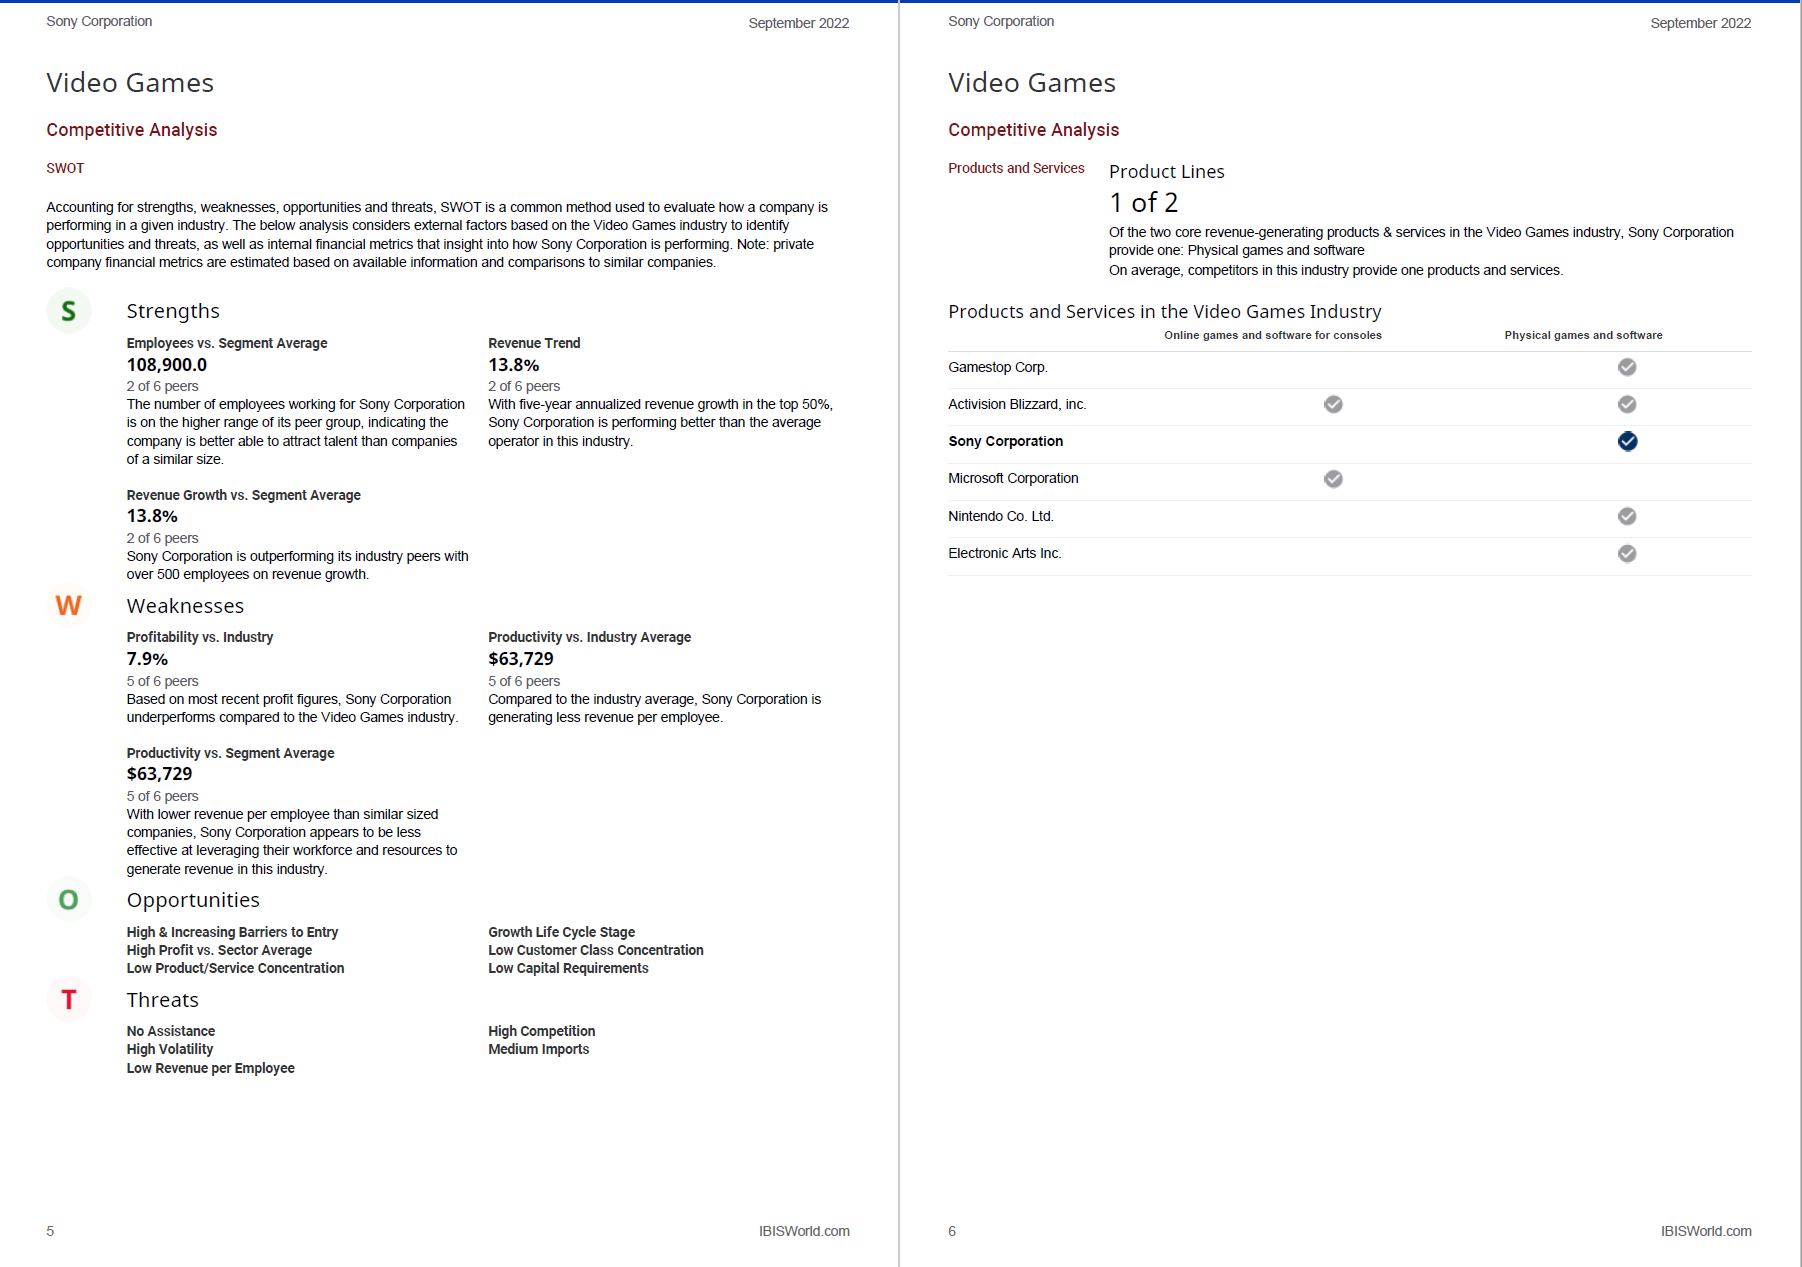
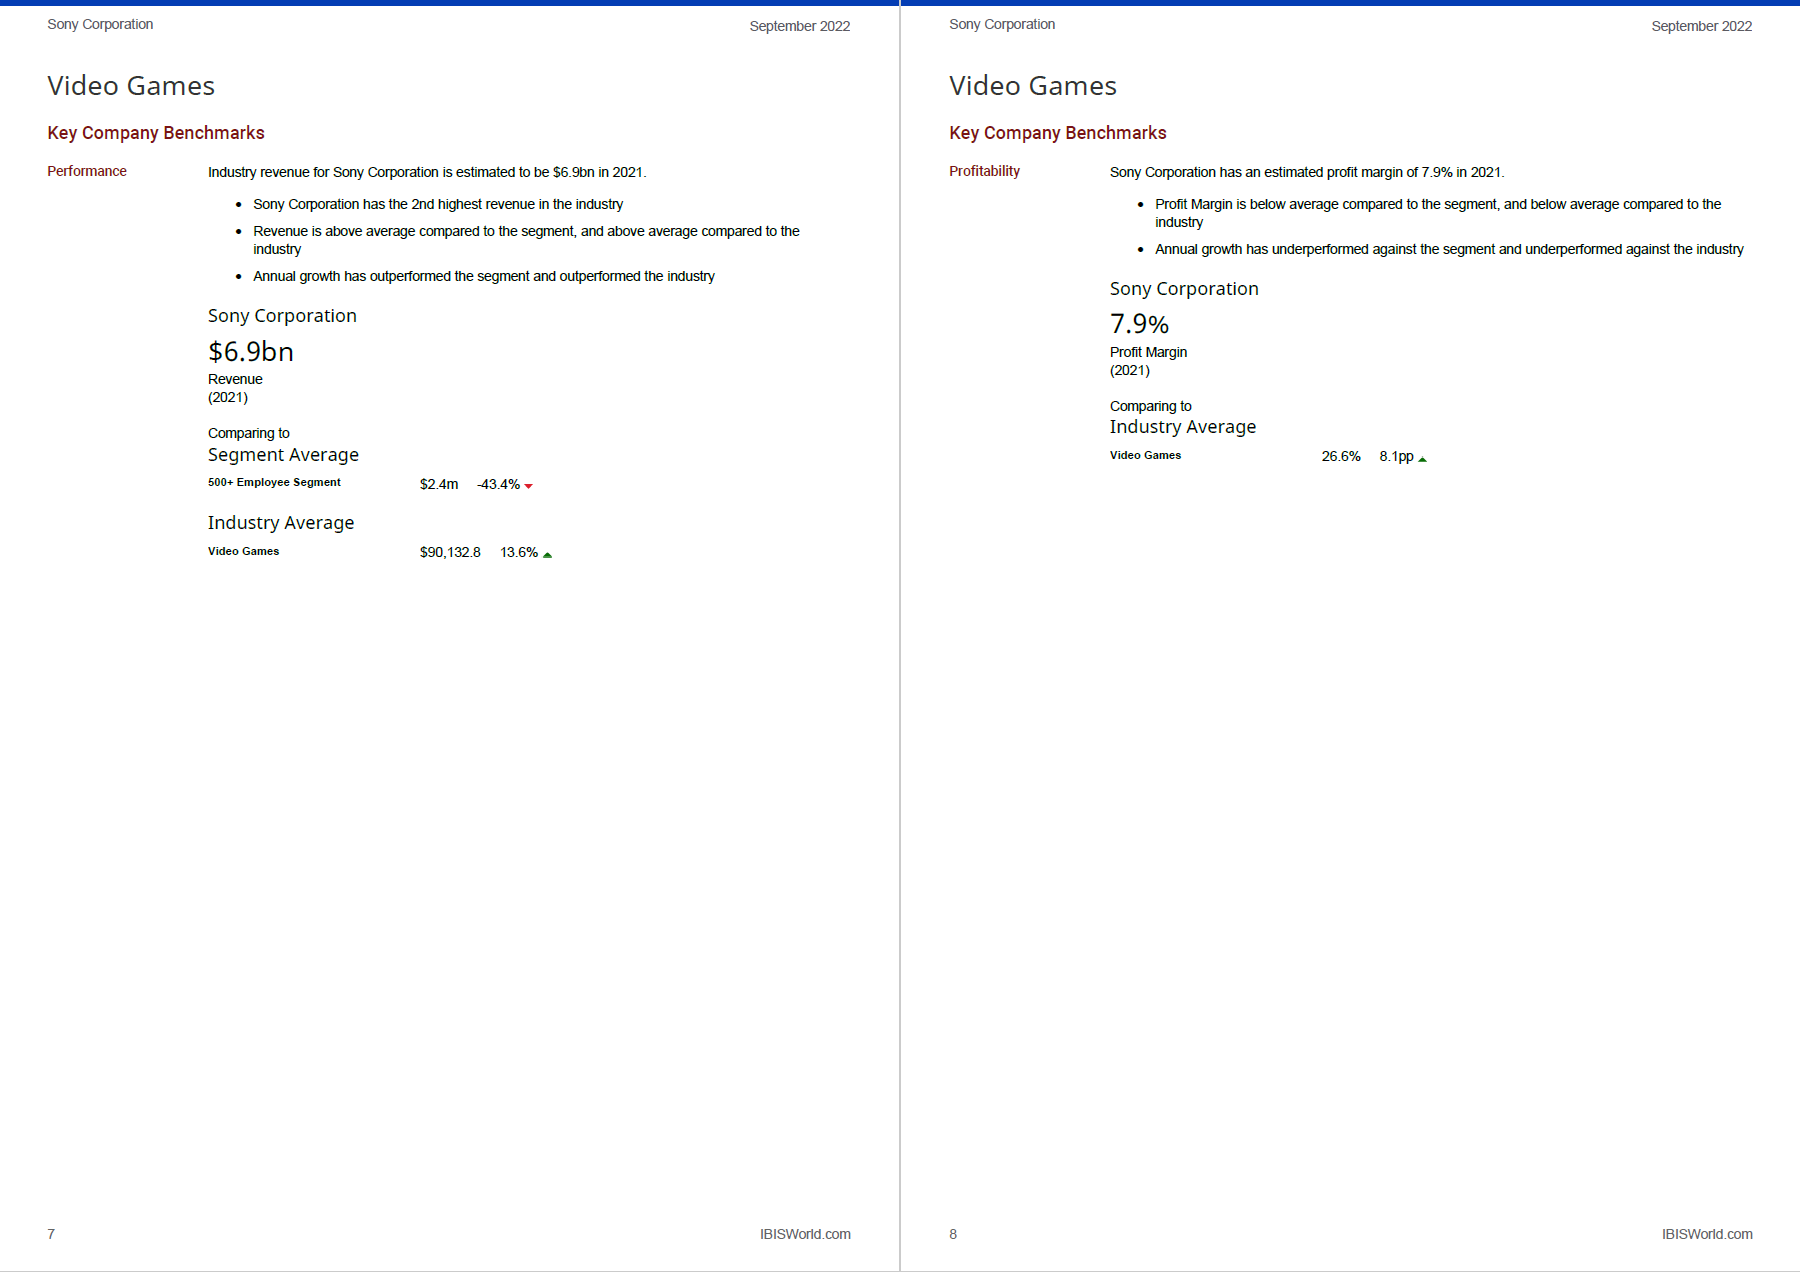
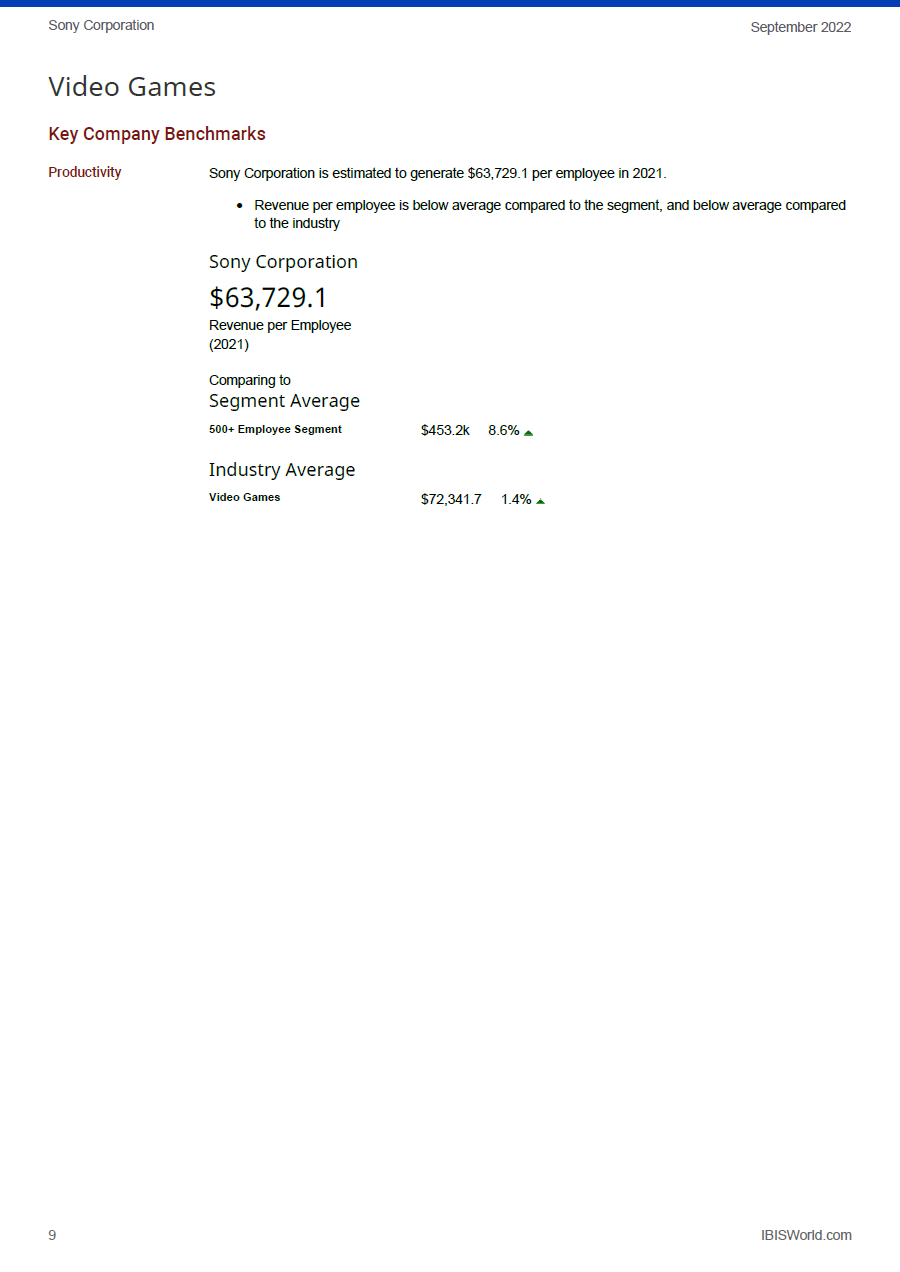
\f\f\fSony Corporation September 2022 IBISWorld Video Games At A Glance WHERE KNOWLEDGE IS POWER Performance Scale Diversification BUS COMPANY BENCHMARKING REPORT Revenue Market Share Product Lines Sony Corporation - Video Games $6.9bn 8.6% 1 of 2 #2 of 6 competitors #2 of 6 competitors Sony Corporation produce 1 of 2 Decreased -0.1% from 2017 revenue-generating products and services in the Video Games Profitability industry. Physical games and software Profit Margin x 1 other products 8% #5 of 6 competitors Productivity Revenue per Employee $63,729.0 #5 of 6 competitors Microsoft Corporation Sony Corporation Nintendo Co. Ltd. Activision Blizzard, inc. Other IBISWorld.com 1-800-330-3772 info@IBISWorld.com 2 IBISWorld.comSony Corporation September 2022 Sony Corporation September 2022 Video Games Video Games Competitive Environment Competitive Environment Industry Market Share Sony Corporation accounts for 8.6% of all revenue in the Video Games in 2021 compared to Microsoft Industry Competitor IBISWorld calculates estimates for each competitors' total company revenue and industry revenue for the Breakdown Corporation, which has the largest industry market share of 10.8%. Sony Corporation has seen a decrease Matrix current year and the next year. By comparing industry competitors' performances against one another, we in their market share of -0. 1pp since 2017 while Microsoft Corporation has decreased by -0.2pp. can identify general characteristics of where that company sits on the quadrant and what that indicates about their performance, productivity and strategy. Video Games in the US - Companies and their Market Share (2021) Video Games - Industry Competitor Matrix Incumbent . All Star An operator with strong An operator with strong 10.8% market share, but profit and market share, profit and Sony Corporation: 8.6% Microsoft Corporation revenue growth is low revenue There are no Incumbent Sony Corporation operators in this industry 59.0% Microsoft Corporation Other Companies Nintendo Co. Lid. Gamestop Cor. Golden Goose Disrupto Nintendo Co. Ltd. An operator with mid to An operator with low to mid- strong market position and market share that is strong profit, but revenue growing rapidly without growth is slow strong profits Electronic Arts Inc.: 3.3% Scale - There are no Golden Goose Activision Blizzard, inc. operators in this industry Source: IBISWorld, Sony Corporation Value - Laggard Rising Star Source: IBISWorld Related Companies *Scale - Higher scale indicates better performance within this An operator with low market An operator with low market industry on factors related to market share. share, profit, and revenue share and strong profit and Competitors Company Type Employee Segment Revenue ($m) Market Share (%) Profit ($m) *Value - Higher value indicates better performance within this growth revenue growth Gamestop Corp. Laggard 500+ Employees 4,218.7 5.24 ndustry on factors related to sales growth and profitability Gamestop Corp Electronic Arts Inc. Activision Blizzard, inc. Disruptor 500+ Employees 4,730.3 5.87 Sony Corporation All Star 500+ Employees 6,940.1 3.62 Microsoft Corporation All Star 500+ Employees 8,723.1 10.83 Nintendo Co. Lid. All Star 500+ Employees 5,826.6 7.23 Electronic Arts Inc. Rising Star 500+ Employees 2,630.0 3.27 IBISWorld.com IBISWorld.comSony Corporation September 2022 Sony Corporation September 2022 Video Games Video Games Competitive Analysis Competitive Analysis SWOT Products and Services Product Lines Accounting for strengths, weaknesses, opportunities and threats, SWOT is a common method used to evaluate how a company is 1 of 2 performing in a given industry. The below analysis considers external factors based on the Video Games industry to identify Of the two core revenue-generating products & services in the Video Games industry, Sony Corporation opportunities and threats, as well as internal financial metrics that insight into how Sony Corporation is performing. Note: private provide one: Physical games and software company financial metrics are estimated based on available information and comparisons to similar companies. On average, competitors in this industry provide one products and services. S Strengths Products and Services in the Video Games Industry Online games and software for consoles Physical games and software Employees vs. Segment Average Revenue Trend 108,900.0 13.8% Gamestop Corp. 2 of 6 peers 2 of 6 peers The number of employees working for Sony Corporation With five-year annualized revenue growth in the top 50%, Activision Blizzard, inc. O is on the higher range of its peer group, indicating the Sony Corporation is performing better than the average company is better able to attract talent than companies operator in this industry. Sony Corporation of a similar size. Microsoft Corporation Revenue Growth vs. Segment Average 13.8% Nintendo Co. Ltd. 2 of 6 peers Sony Corporation is outperforming its industry peers with Electronic Arts Inc. over 500 employees on revenue growth. W Weaknesses Profitability vs. Industry Productivity vs. Industry Average 7.9% $63,729 5 of 6 peers 5 of 6 peers Based on most recent profit figures, Sony Corporation Compared to the industry average, Sony Corporation is underperforms compared to the Video Games industry. generating less revenue pe Productivity vs. Segment Average $63,729 5 of 6 peers With lower revenue per employee than similar sized companies, Sony Corporation appears to be less effective at leveraging their workforce and resources to generate revenue in this industry. O Opportunities High & Increasing Barriers to Entry Growth Life Cycle Stage High Profit vs. Sector Average Low Customer Class Concentration Low Product/Service Concentration Low Capital Requirements T Threats No Assistance High Competition High Volatility Medium Imports Low Revenue per Employee IBISWorld.com 6 IBISWorld.comSony Corporation September 2022 Sony Corporation September 2022 Video Games Video Games Key Company Benchmarks Key Company Benchmarks Performance Industry revenue for Sony Corporation is estimated to be $6.9bn in 2021. Profitability Sony Corporation has an estimated profit margin of 7.9% in 2021. . Sony Corporation has the 2nd highest revenue in the industry Profit Margin is below average compared to the segment, and below average compared to the industry . Revenue is above average compared to the segment, and above average compared to the industry . Annual growth has underperformed against the segment and underperformed against the industry . Annual growth has outperformed the segment and outperformed the industry Sony Corporation Sony Corporation 7.9% $6.9bn Profit Margin (2021) Revenue (2021) Comparing to Industry Average Comparing to Segment Average Video Games 26.6% 8.1pp 500+ Employee Segment $2.4m -43.4% - Industry Average Video Games $90,132.8 13.6% IBISWorld.com 8 IBISWorld.comSony Corporation Video Games Key Company Benchmarks Productivity Sony Corporation is estimated to generate $63,729.'l per employee in 2021. September 2022 . Revenue per employee is below average compared to the segment, and below average compared to the industry Sony Corporation $63,729.1 Revenue per Employee (2021) Comparing to Segment Average 500+ Employee Segment Industry Average Video Games $453.2K $72,341 .? 8.6% A 1.4% A IBISWOFIGLOD'I
Step by Step Solution
There are 3 Steps involved in it
1 Expert Approved Answer
Step: 1 Unlock
Question Has Been Solved by an Expert!
Get step-by-step solutions from verified subject matter experts
Step: 2 Unlock
Step: 3 Unlock
Students Have Also Explored These Related Accounting Questions!