

Question: Here followed are a company's sales data. a. (6') Plot the data and provide insights about the time series. b. (56') What are the forecasts
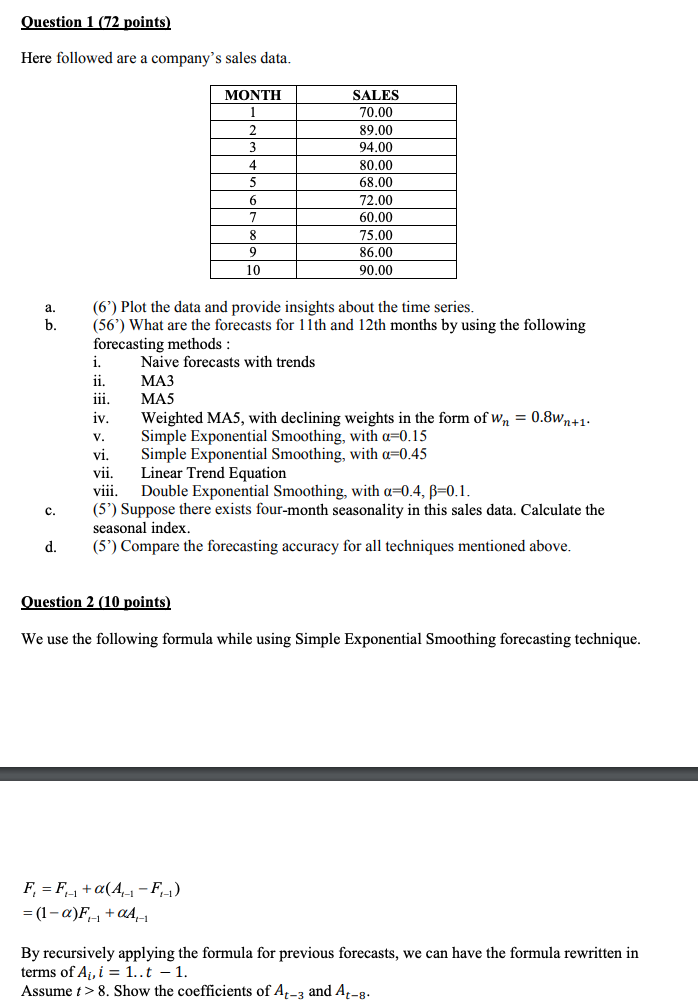
Here followed are a company's sales data. a. (6') Plot the data and provide insights about the time series. b. (56') What are the forecasts for 11 th and 12th months by using the following forecasting methods : i. Naive forecasts with trends ii. MA3 iii. MA5 iv. Weighted MA5, with declining weights in the form of wn=0.8wn+1. v. Simple Exponential Smoothing, with =0.15 vi. Simple Exponential Smoothing, with =0.45 vii. Linear Trend Equation viii. Double Exponential Smoothing, with =0.4,=0.1. c. (5') Suppose there exists four-month seasonality in this sales data. Calculate the seasonal index. d. (5') Compare the forecasting accuracy for all techniques mentioned above. Question 2 (10 points) We use the following formula while using Simple Exponential Smoothing forecasting technique. Ft=Ft1+(At1Ft1)=(1)Ft1+At1 By recursively applying the formula for previous forecasts, we can have the formula rewritten in terms of Ai,i=1..t1. Assume t>8. Show the coefficients of At3 and At8
Step by Step Solution
There are 3 Steps involved in it

Get step-by-step solutions from verified subject matter experts