

Question: Here is a data set that has a nearly normal distribution. data data data data 56.23 62.02 63.21 28.29 52.14 54.73 52.35 45.19 66.07 48.04
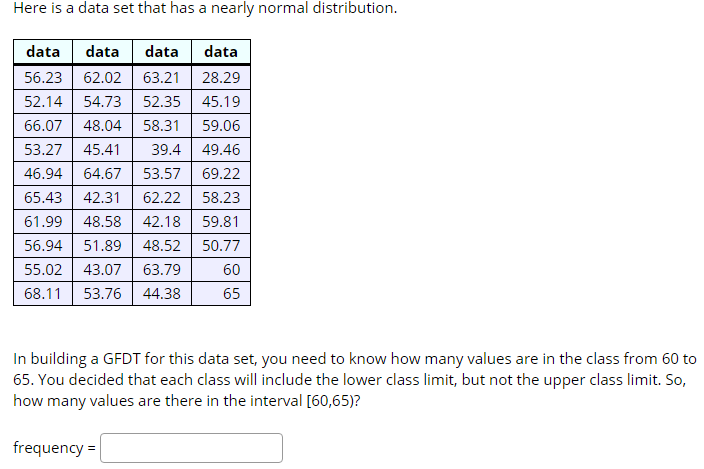
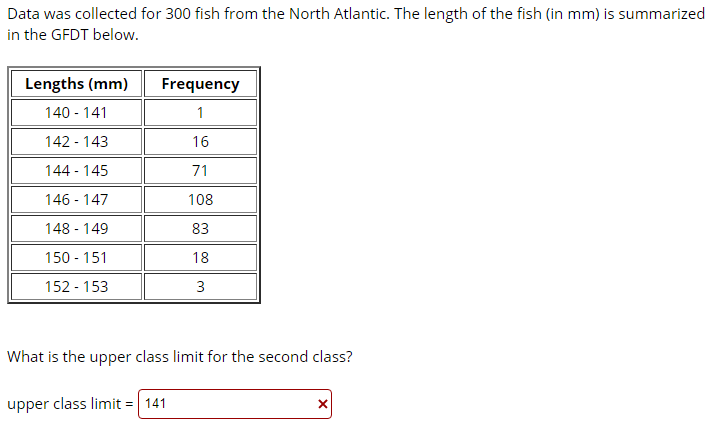
Here is a data set that has a nearly normal distribution. data data data data 56.23 62.02 63.21 28.29 52.14 54.73 52.35 45.19 66.07 48.04 58.31 59.06 53.27 45.41 39.4 49.46 46.94 64.67 53.57 69.22 65.43 42.31 62.22 58.23 61.99 48.58 42.18 59.81 56.94 51.89 48.52 50.77 55.02 43.07 63.79 60 68.11 53.76 44.38 65 In building a GFDT for this data set, you need to know how many values are in the class from 60 to 65. You decided that each class will include the lower class limit, but not the upper class limit. So, how many values are there in the interval [60,65)? frequency =Data was collected for 300 fish from the North Atlantic. The length of the fish (in mm) is summarized in the GFDT below. Lengths (mm) Frequency 140 - 141 142 - 143 16 144 - 145 71 146 - 147 108 148 - 149 83 150 - 151 18 152 - 153 3 What is the upper class limit for the second class? upper class limit = 141 X
Step by Step Solution
There are 3 Steps involved in it

Get step-by-step solutions from verified subject matter experts