

Question: Here is a sample data set that appears to be nearly normal (as suggested by the histogram). 68.7 64 63.2 73.6 82.9 71.2 48.4 74.8
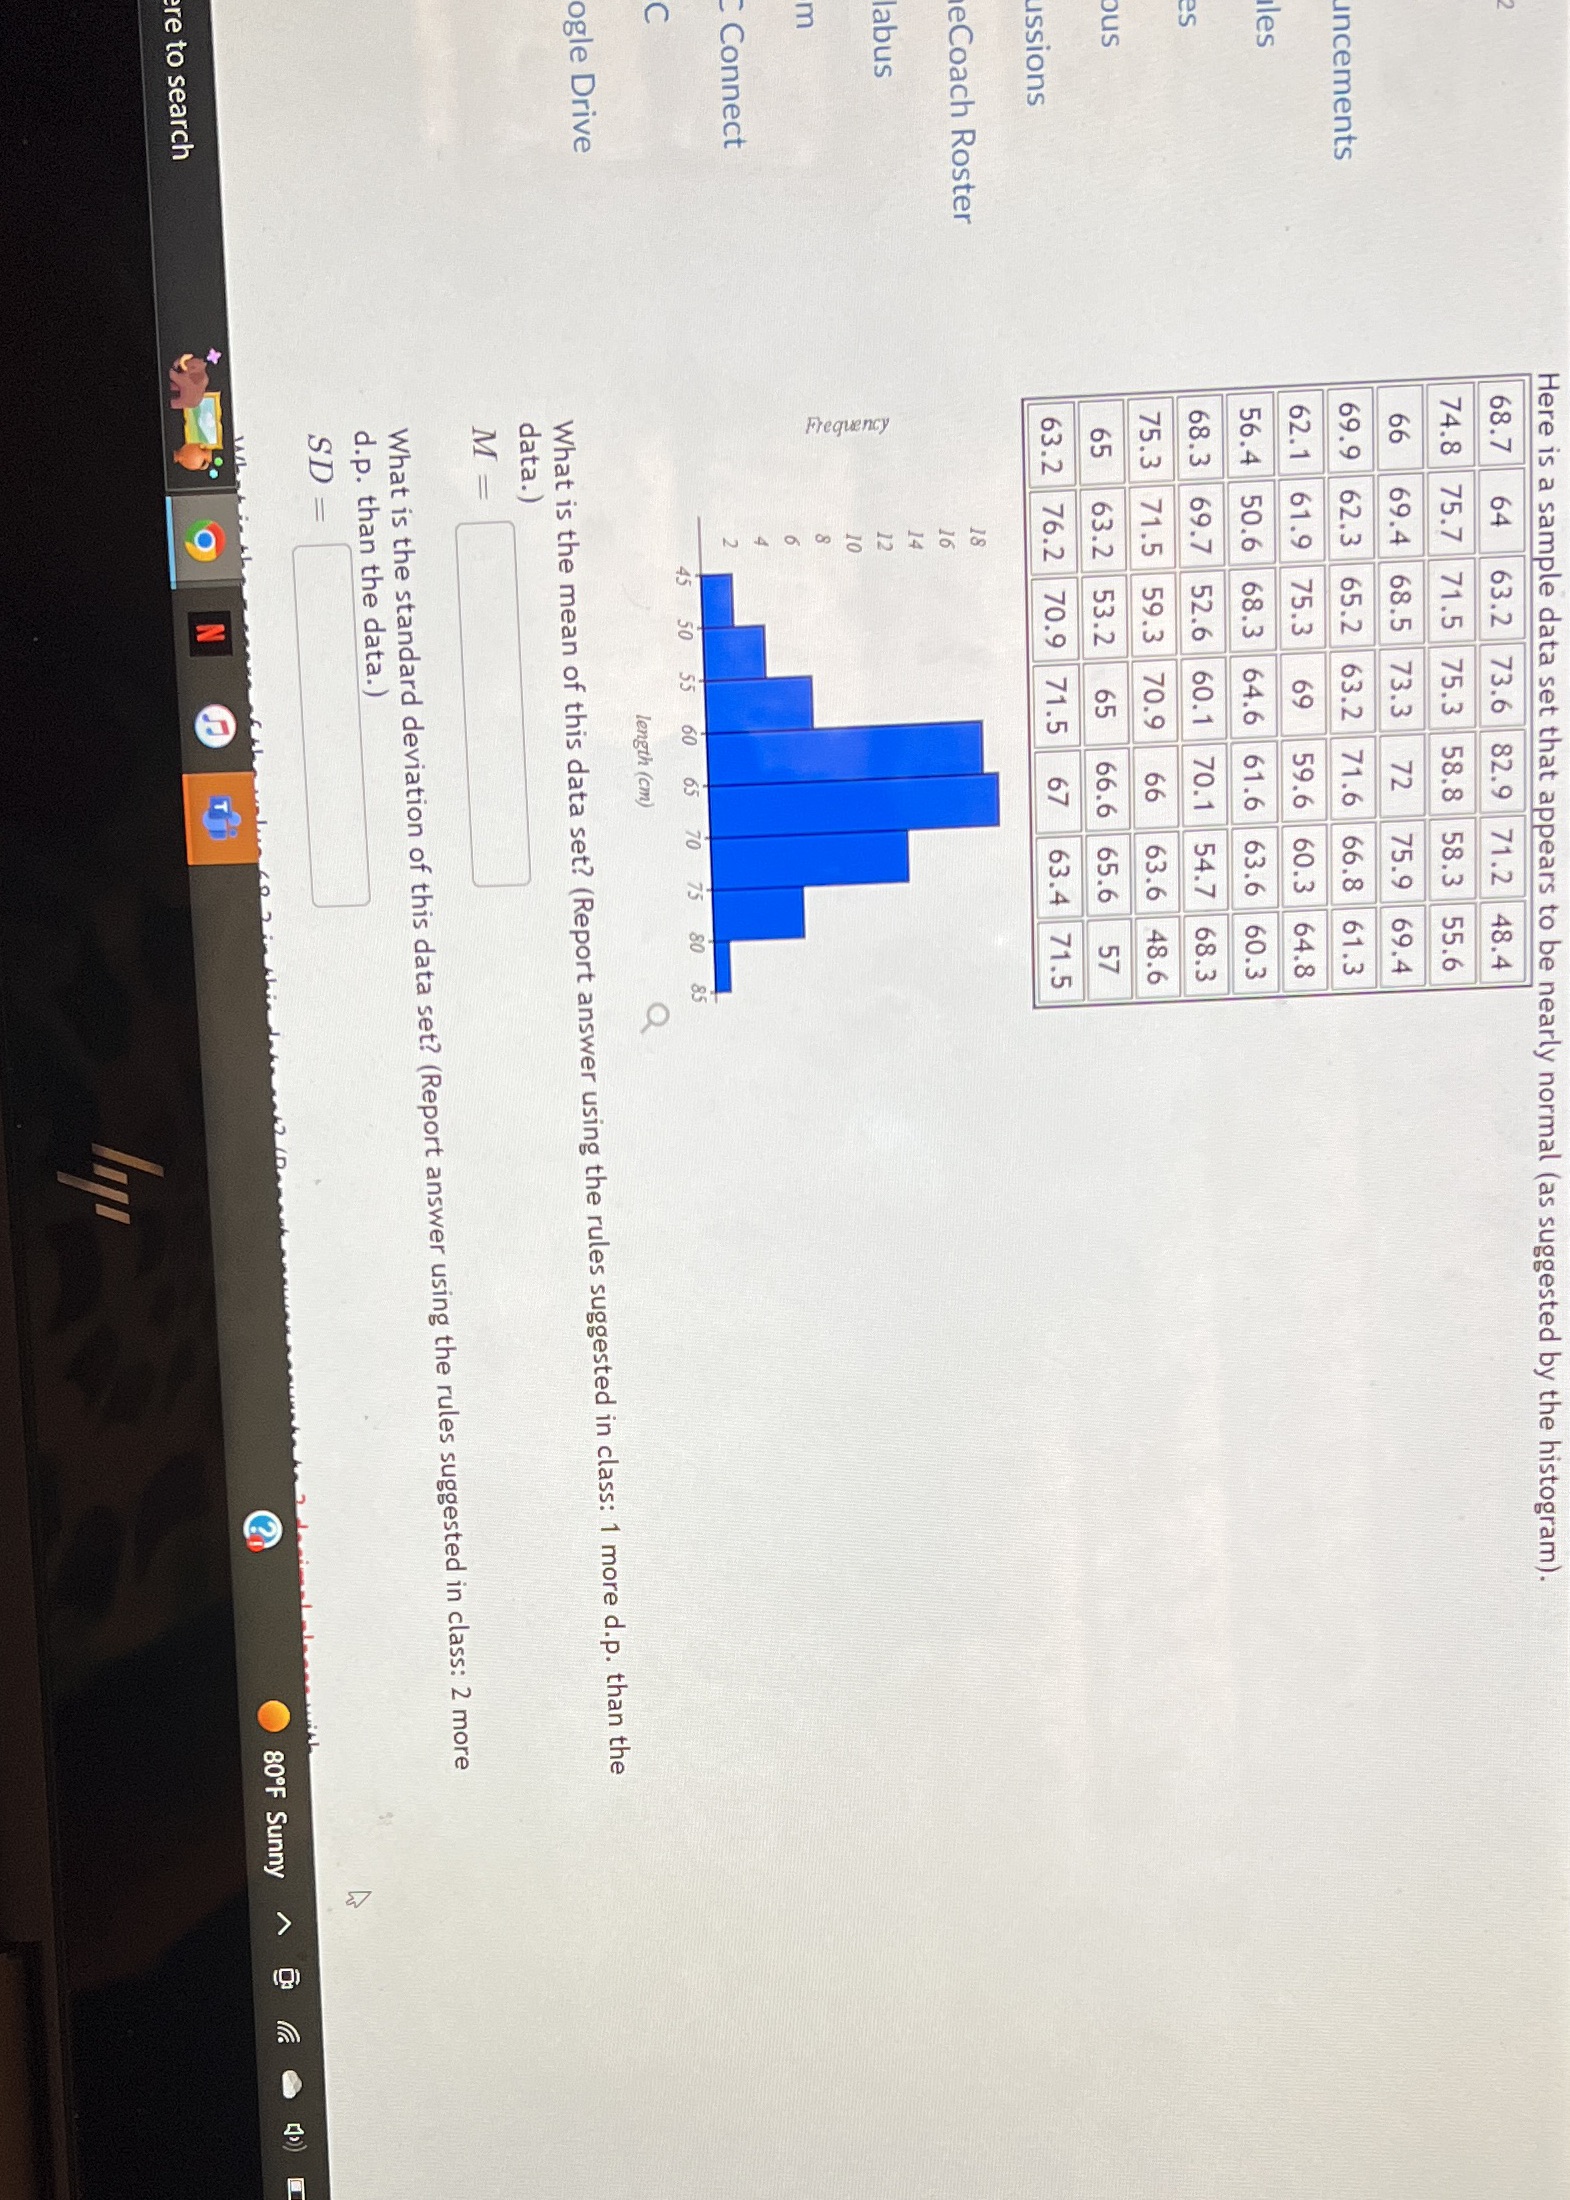
Here is a sample data set that appears to be nearly normal (as suggested by the histogram). 68.7 64 63.2 73.6 82.9 71.2 48.4 74.8 75.7 71.5 75.3 58.8 58.3 55.6 69.4 68.5 73.3 72 75.9 69.4 uncements 69.9 62.3 65.2 63.2 71.6 66.8 61.3 62.1 61.9 75.3 69 les 59.6 60.3 64.8 56.4 50.6 68.3 64.6 61.6 63.6 60.3 68.3 69.7 52.6 60.1 70.1 54.7 68.3 75.3 71.5 59.3 70.9 66 63.6 48.6 us 63.2 53.2 66.6 65.6 57 ussions 63.2 76.2 70.9 71.5 67 63.4 71.5 eCoach Roster abus E Connect N 45 50 55 60 65 70 75 80 85 U length (cm) O ogle Drive What is the mean of this data set? (Report answer using the rules suggested in class: 1 more d.p. than the data.) M = What is the standard deviation of this data set? (Report answer using the rules suggested in class: 2 more d.p. than the data.) SD = 80 F Sunny O re to search
Step by Step Solution
There are 3 Steps involved in it

Get step-by-step solutions from verified subject matter experts