

Question: Here is an ANOVA table from a statistical analysis. Use it to answer questions 6-10. Source DF SS MS F-stat P-value Model 1 286.48898 286.48898
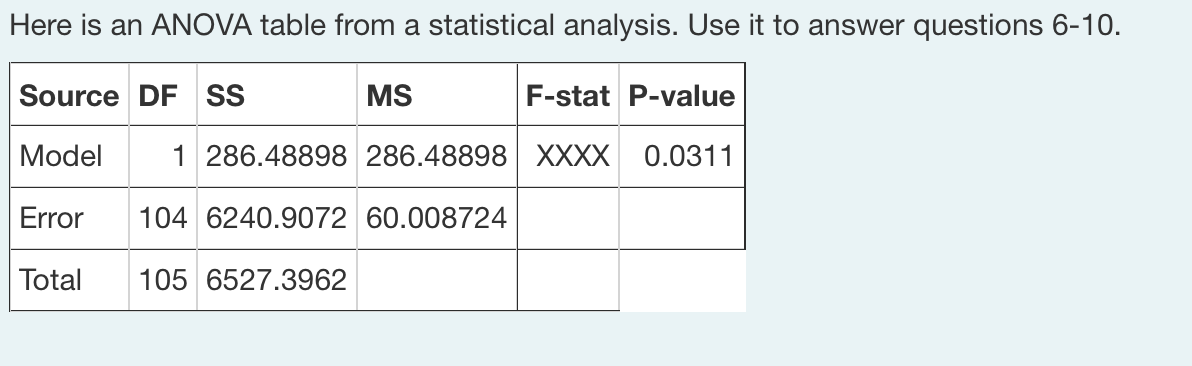


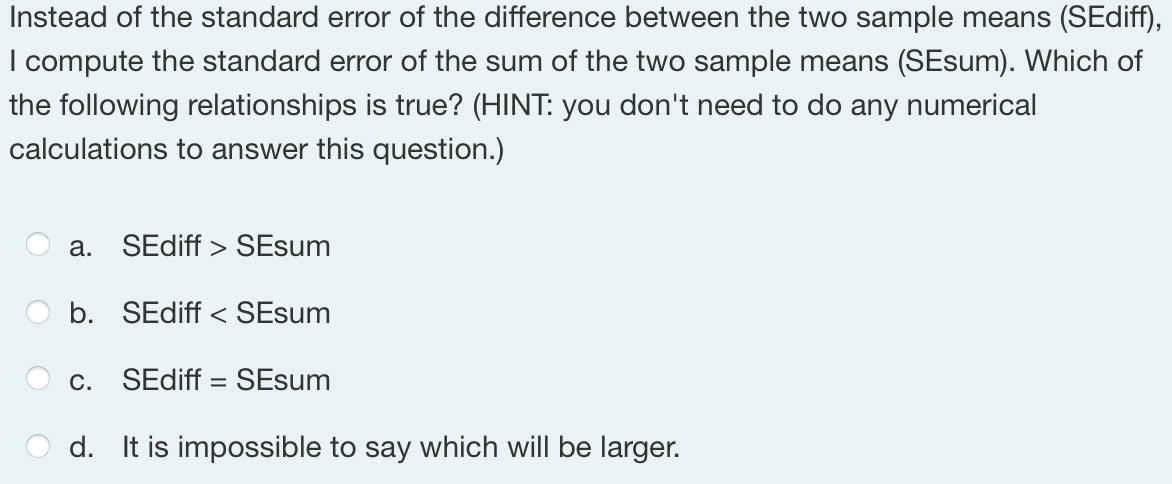
Here is an ANOVA table from a statistical analysis. Use it to answer questions 6-10. Source DF SS MS F-stat P-value Model 1 286.48898 286.48898 XXXX 0.0311 Error 104 6240.9072 60.008724 Total 105 6527.3962How many individuals were in the sample leading to these results? The standard deviation of the residuals can be estimated from this ANOVA table. The value of that estimate is What percentage of variation in the response variable is explained by this model? The value of the F statistic is not shown in the ANOVA table. Find the value of F. What was the value of the denominator degrees of freedom for this F statistic? Instead of the standard error of the difference between the two sample means (SEdiff), I compute the standard error of the sum of the two sample means (SEsum). Which of the following relationships is true? (HINT: you don't need to do any numerical calculations to answer this question.) O a. SEdiff > SEsum O b. SEdiff
Step by Step Solution
There are 3 Steps involved in it

Get step-by-step solutions from verified subject matter experts