

Question: Here is my chart I got y=200sin(360/24(x-16)But when I plot it on a sinusidal graph it doesn't line up it lines up with x-10. Where
Here is my chart I got y=200sin(360/24(x-16)But when I plot it on a sinusidal graph it doesn't line up it lines up with x-10. Where did I go wrong?
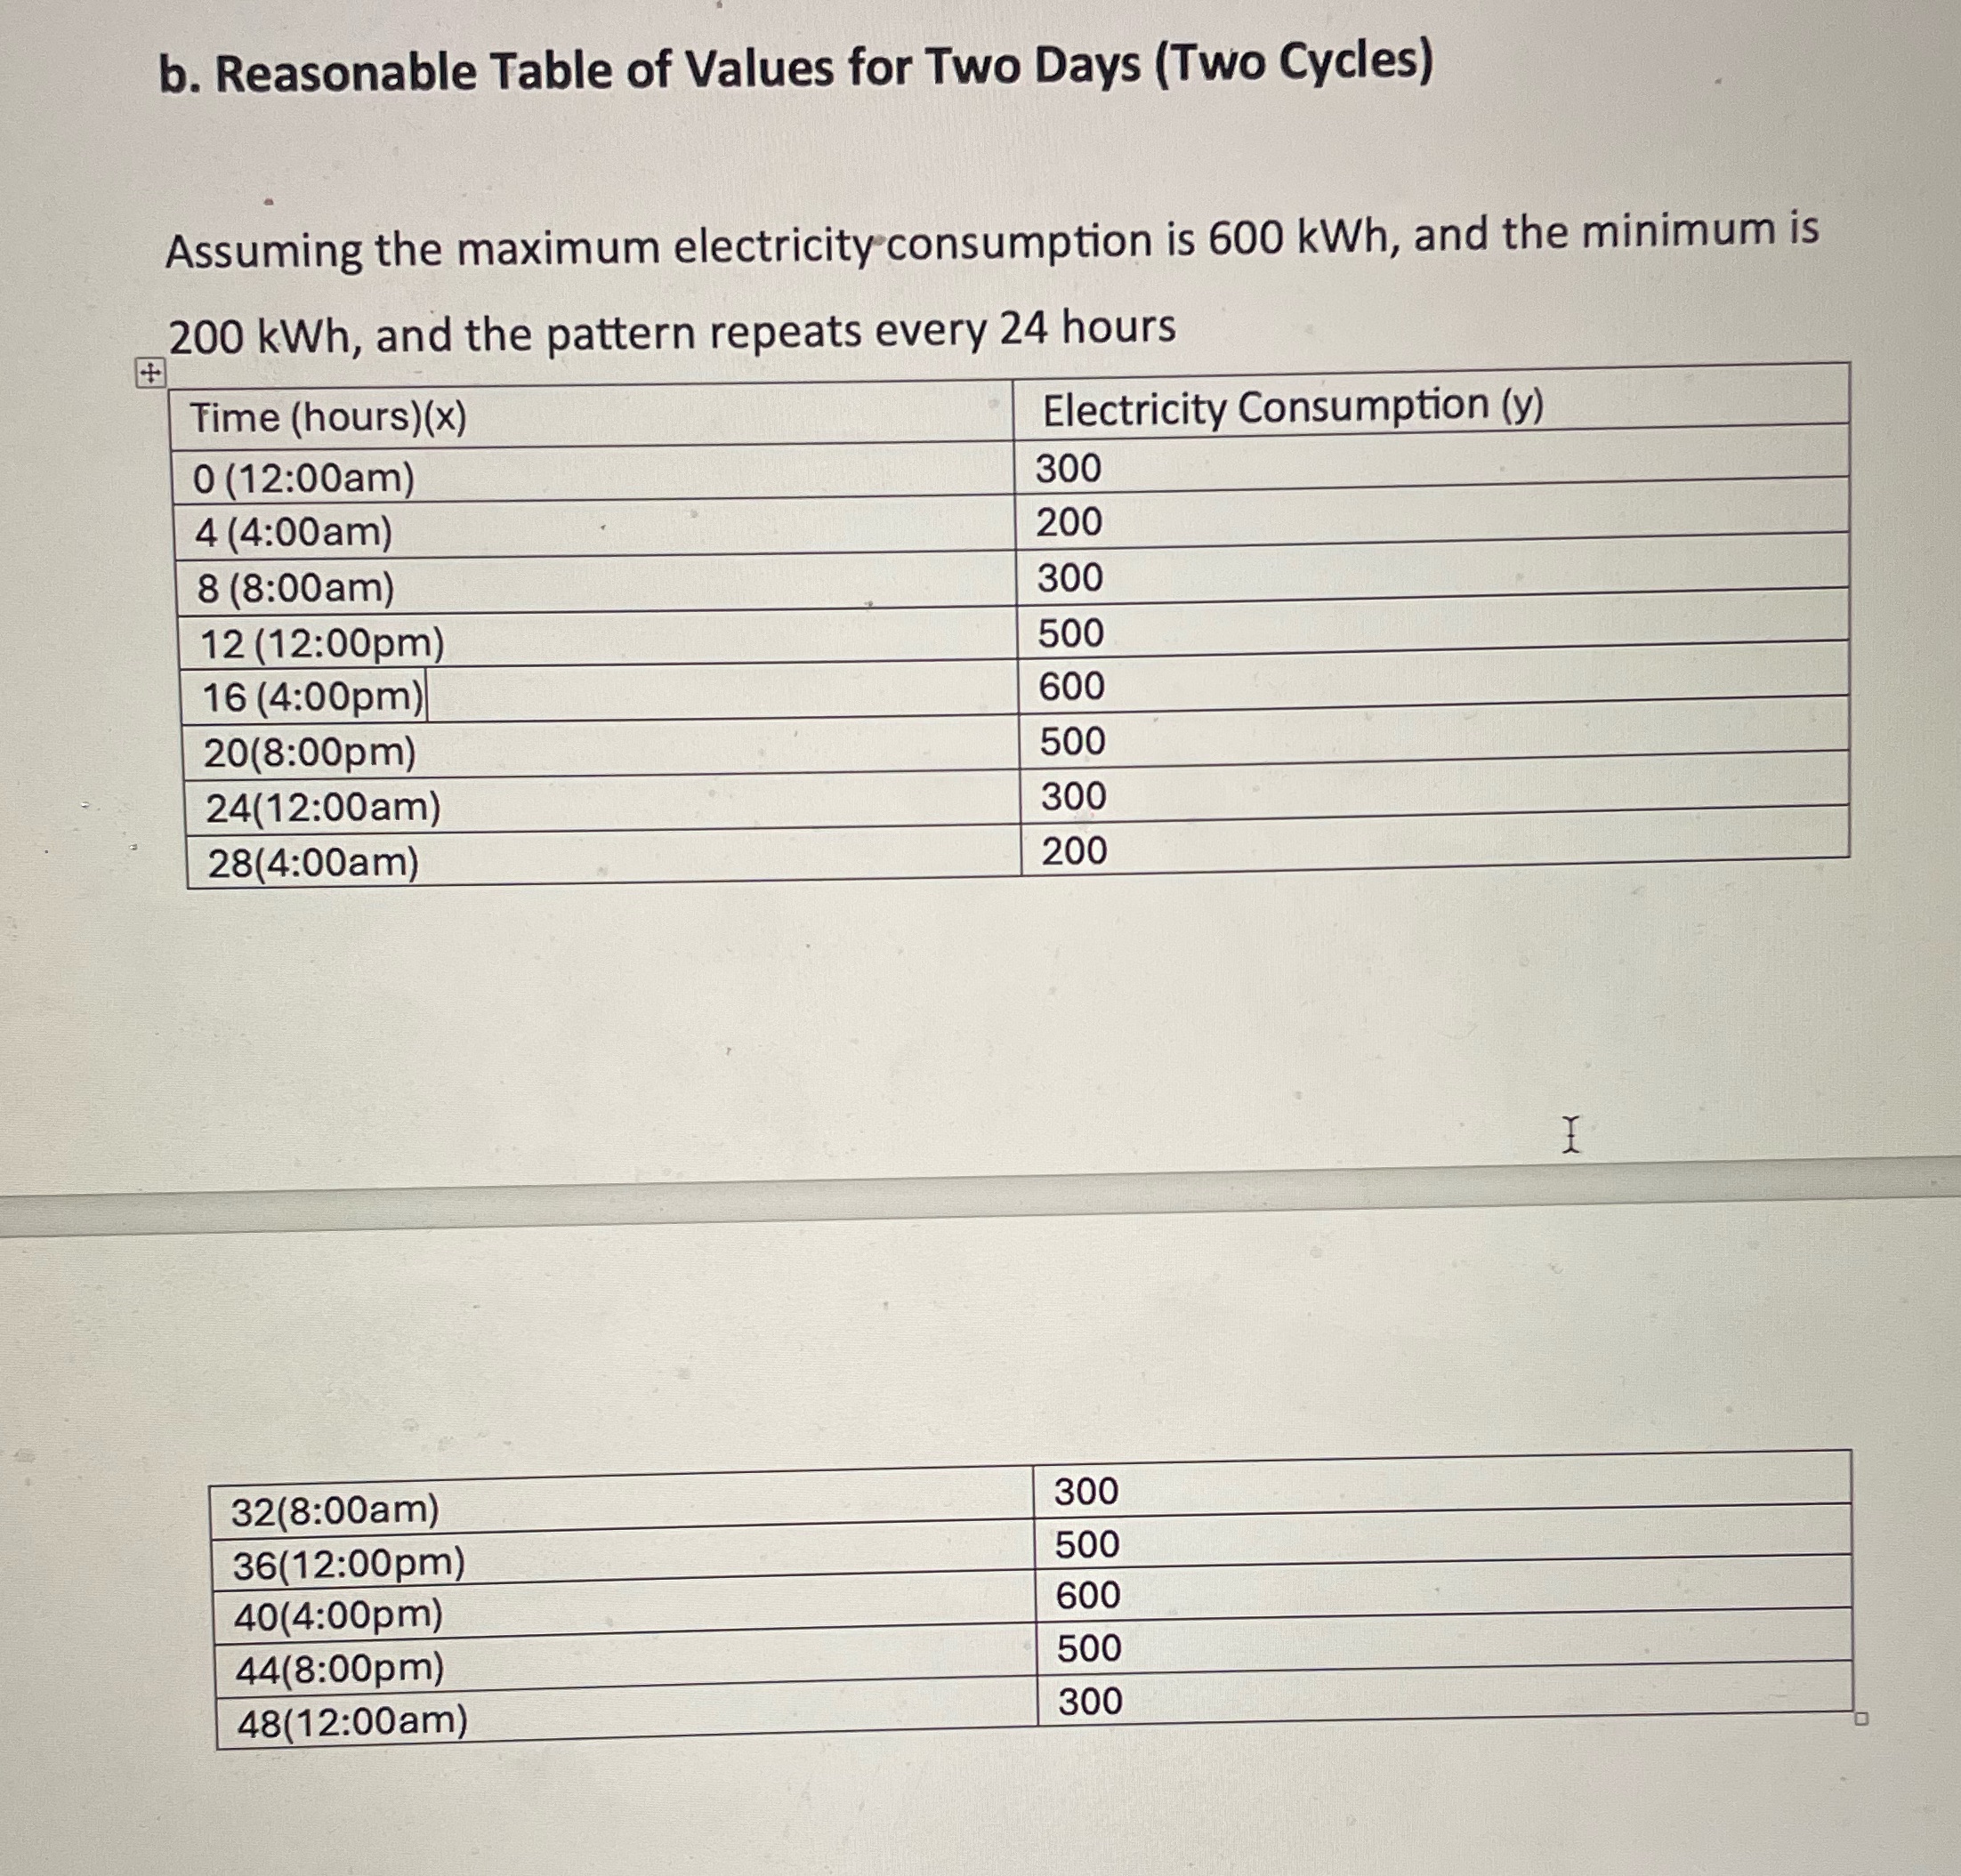
b. Reasonable Table of Values for Two Days (Two Cycles) Assuming the maximum electricity consumption is 600 KWh, and the minimum is 200 kWh, and the pattern repeats every 24 hours Time (hours)(x) Electricity Consumption (y) 0 (12:00am) 300 4 (4:00am) 200 8 (8:00am) 300 12 (12:00pm) 500 16 (4:00pm) 600 20(8:00pm) 500 24(12:00am) 300 28(4:00am) 200 32(8:00am) 300 36(12:00pm) 500 40(4:00pm 600 44(8:00pm) 500 48(12:00am) 300
Step by Step Solution
There are 3 Steps involved in it
1 Expert Approved Answer
Step: 1 Unlock

Question Has Been Solved by an Expert!
Get step-by-step solutions from verified subject matter experts
Step: 2 Unlock
Step: 3 Unlock