

Question: HERE IS MY CODE BELOW IN GOOGLE COLAB, I get an error on this line ( df_london = df[(df['London']) & (df['Fuel Type'] == 'Regular Unleaded
HERE IS MY CODE BELOW IN GOOGLE COLAB, I get an error on this line (df_london = df[(df['London']) & (df['Fuel Type'] == 'Regular Unleaded Gasoline')]) and I'm not sure how to implement it properly. The file I'm working at is linked here https://data.ontario.ca/dataset/fuels-price-survey-information . Have to rename it to fueltypesall1991-2023.csv
![error on this line (df_london = df[(df['London']) & (df['Fuel Type'] == 'Regular](https://dsd5zvtm8ll6.cloudfront.net/si.experts.images/questions/2024/09/66f95f2b9bdb5_85966f95f2b4d566.jpg)
Please don't reference df['Area'] as it is non-existent in the file.
--------------------------------------------------------------------------------------------------------------------------------------
import io
from google.colab import files
uploaded = files.upload()
import pandas as pd
import matplotlib.pyplot as plt
# Read the data
df = pd.read_csv(io.BytesIO(uploaded['fueltypesall1991-2023.csv']))
# Select only Regular Unleaded Gasoline prices in London
df_london = df[(df['London']) & (df['Fuel Type'] == 'Regular Unleaded Gasoline')]
#Conversion of string to timepyEX
df_london['Date'] = pd.to_datetime(df_london['Date'])
#Set index of dataframe
df_london.set_index('Date', inplace=True)
# Smooth the time series using simple moving average with windowsize=5
rolling = df['Price'].rolling(window=5)
ma = rolling.mean()
# Plot the original and smoothed time series
plt.plot(df['Price'], label='Original')
plt.plot(ma, label='Simple Moving Average (window=5)')
plt.title('Regular Unleaded Gasoline Prices in London (2000-2022)')
plt.xlabel('Year')
plt.ylabel('Price (pence per litre)')
plt.legend()
plt.show()
--------------------------------------------------------------------------------------------------------------------------------------
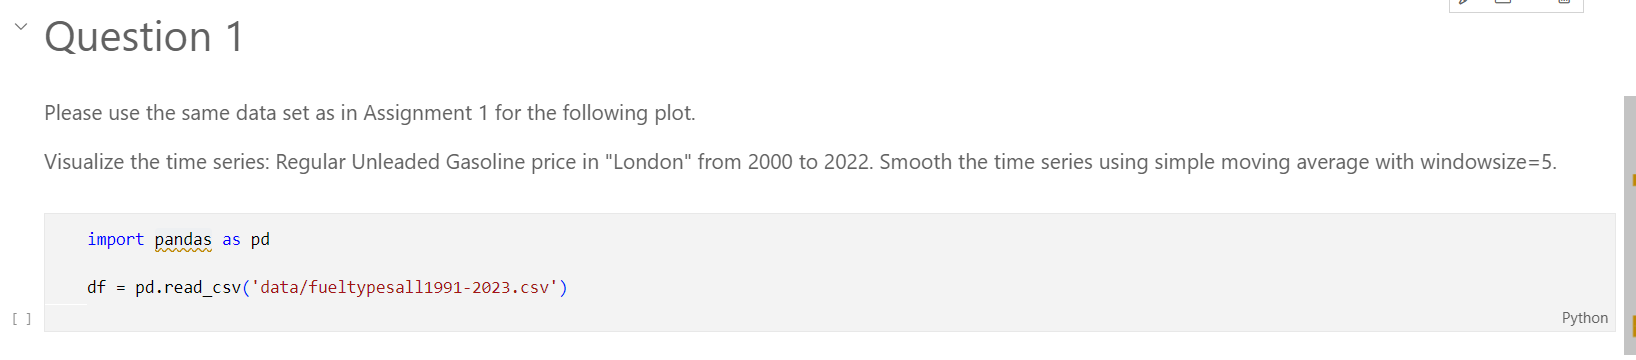
Please use the same data set as in Assignment 1 for the following plot. Visualize the time series: Regular Unleaded Gasoline price in "London" from 2000 to 2022 . Smooth the time series using simple moving average with windowsize =5. import pandas as pd \[ d f=\text { pd.read_csv('data/fueltypesall1991-2023.csv') } \] 1990-01-03 - N/A Data English and French
Step by Step Solution
There are 3 Steps involved in it

Get step-by-step solutions from verified subject matter experts