

Question: Here is the assignment. It would not allow me to upload an excel spreadsheet, change the due date, or raise the payment. It is due
Here is the assignment. It would not allow me to upload an excel spreadsheet, change the due date, or raise the payment. It is due March 8, 2018, I am willing to pay more.
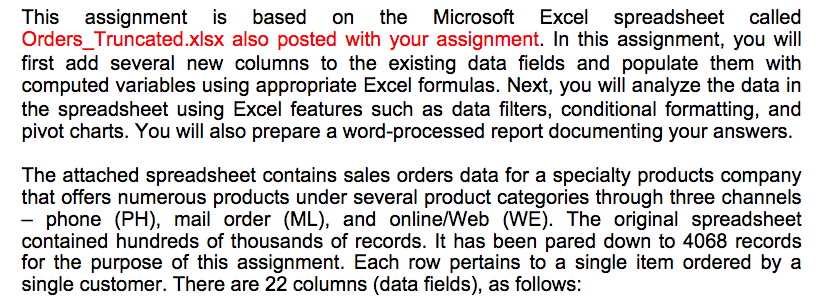
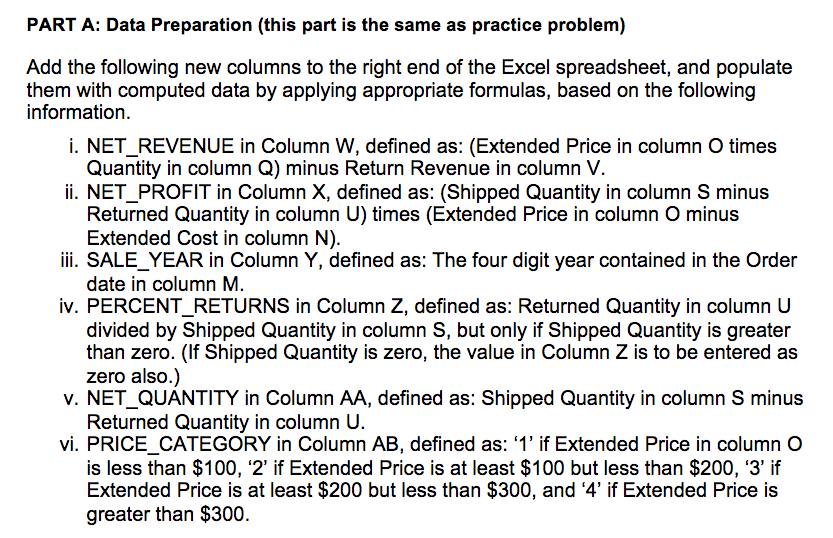
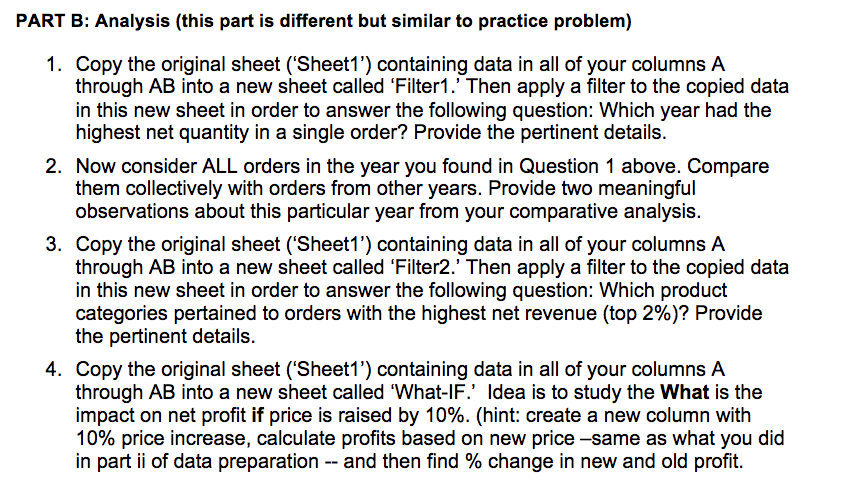
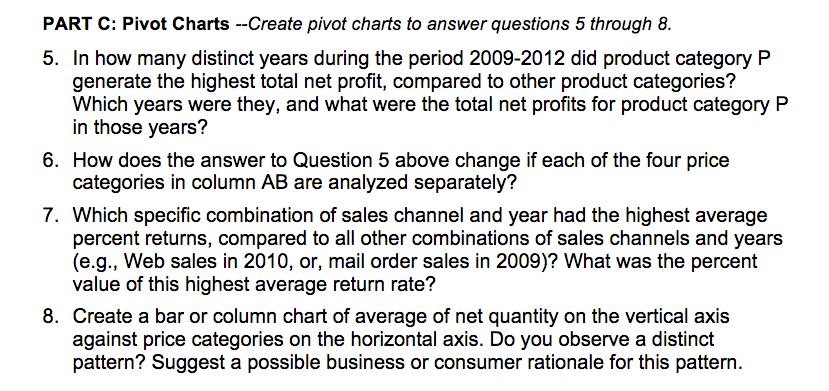
This assignment is based on the Microsoft Excel spreadsheet called Orders_Truncated.xlsx also posted with your assignment. In this assignment, you will rst add several new columns to the existing data elds and populate them with computed variables using appropriate Excel formulas. Next, you will analyze the data in the spreadsheet using Excel features such as data ltersI conditional formatting, and pivot charts. You will also prepare a word-processed report documenting your answers. The attached spreadsheet contains sales orders data for a specialty products company that offers numerous products under several product categories through three channels - phone {PH}, mail order (ML), and onlineIWeb (WE). The original spreadsheet contained hundreds of thousands of records. It has been pared down to 4068 records for the purpose of this assignment. Each row pertains to a single item ordered by a single customer. There are 22 columns (data elds), as follows: PART A: Data Preparation {this part is the same as practice problem) Add the following new columns to the right end cf the Excel spreadsheetI and populate them with computed data by applying appropriate formulas, based on the following information. i. NET_REVENUE in Column W, dened as: (Extended Price in column 0 times Quantity in column Q) minus Return Revenue in column V. ii. NET_PROFIT in Column X, dened as: (Shipped Quantity in column 8 minus Returned Quantity in column U) times (Extended Price in column 0 minus Extended Cost in column N). iii. SALE_YEAR in Column Y, dened as: The four digit year contained in the Order date in column M. iv. PERCENT_RETURNS in Column 2, dened as: Returned Quantity in column U divided by Shipped Quantity in column 3, but only if Shipped Quantity is greater than zero. (If Shipped Quantity is zero, the value in Column Z is to be entered as zero also.) v. NET_QUANTITY in Column AA, dened as: Shipped Quantity in column S minus Returned Quantity in column U. vi. PRICE_CATEGORY in Column AB, dened as: '1' if Extended Price in column 0 is less than $100, '2' if Extended Price is at least $100 but less than $200, '3' if Extended Price is at least $200 but less than $300, and '4' if Extended Price is greater than $300. PART B: Analysis (this part is different but similar to practice problem} 1. Copy the original sheet ('Sheet1') containing data in all of your columns A through AB into a new sheet called 'Filter1.' Then apply a lter to the copied data in this new sheet in order to answer the following question: Which year had the highest net quantity in a single order? Provide the pertinent details. 2. Now consider ALL orders in the year you found in Question 1 above. Compare them collectively with orders from other years. Provide two meaningful observations about this particular year from your comparative analysis. 3. Copy the original sheet ('Sheet1') containing data in all of your columns A through AB into a new sheet called 'Filter2.' Then apply a lter to the copied data in this new sheet in order to answer the following question: Which product categories pertained to orders with the highest net revenue (top 2%)? Provide the pertinent details. 4. Copy the original sheet ('Sheet1') containing data in all of your columns A through AB into a new sheet called 'What-lF.' Idea is to study the What is the impact on net prot if price is raised by 10%. (hint: create a new column with 10% price increase, calculate prots based on new price -same as what you did in part ii of data preparation -- and then nd "fa change in new and old prot. PART c: Pivot Charts --Creete pivot charts to answer questions 5 through 3. 5. In how many distinct years during the period 2009-2012 did product category P generate the highest total net prot, compared to other product categories? Which years were they. and what were the total net prots for product category P in those years? How does the answer to Question 5 above change if each of the four price categories in column AB are analyzed separately? Which specic combination of sales channel and year had the highest average percent returnsI compared to all other combinations of sales channels and years (e.g., Web sales in 2010, or, mail order sales in 2009)? What was the percent value of this highest average return rate? Create a bar or column chart of average of net quantity on the vertical axis against price categories on the horizontal axis. Do you observe a distinct pattern? Suggest a possible business or consumer rationale for this pattern
Step by Step Solution
There are 3 Steps involved in it

Get step-by-step solutions from verified subject matter experts