

Question: Here is the data on maintenance costs and the hours of use of the mills of an industrial mill. Annual usage (hundreds of hours) Annual

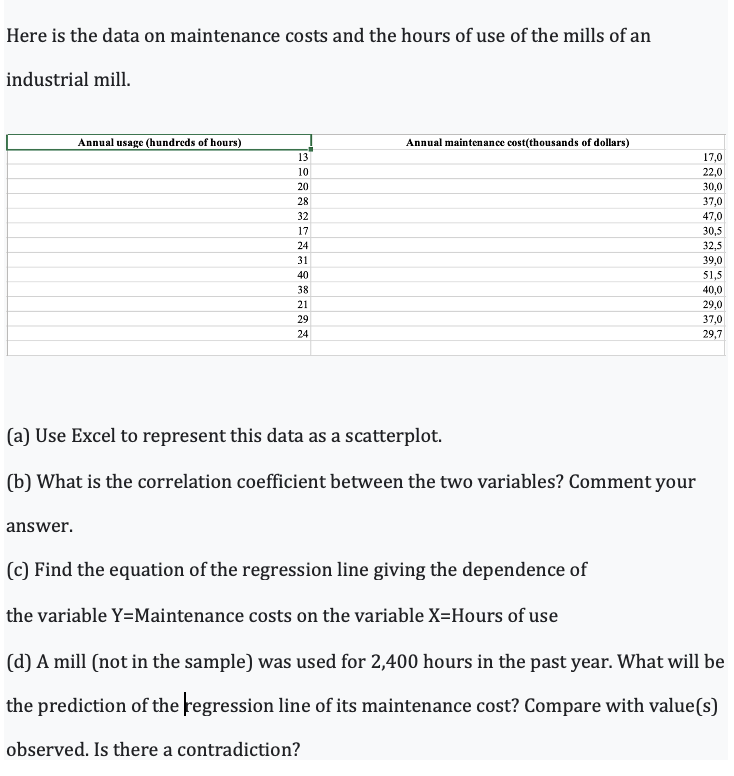
Here is the data on maintenance costs and the hours of use of the mills of an industrial mill. Annual usage (hundreds of hours) Annual maintenance cost(thousands of dollars) 13 17,0 10 22.0 20 30,0 28 37,0 32 47,0 17 30,5 24 32,5 31 39,0 40 51,5 38 40,0 21 29,0 29 37,0 24 29 7 (a) Use Excel to represent this data as a scatterplot. (b) What is the correlation coefficient between the two variables? Comment your answer. (c) Find the equation of the regression line giving the dependence of the variable Y=Maintenance costs on the variable X=Hours of use (d) A mill (not in the sample) was used for 2,400 hours in the past year. What will be the prediction of the regression line of its maintenance cost? Compare with value(s) observed. Is there a contradiction
Step by Step Solution
There are 3 Steps involved in it

Get step-by-step solutions from verified subject matter experts