

Question: HERE IS THE EXAMPLE Choose only 3 ratios from bottom 1. Use the template to do the ratio analysis. Note that the template is only
HERE IS THE EXAMPLE
Choose only 3 ratios from bottom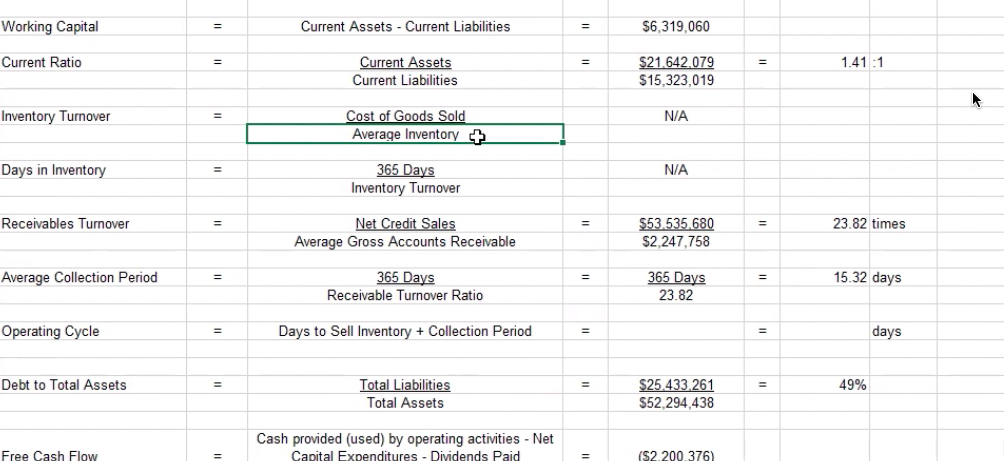
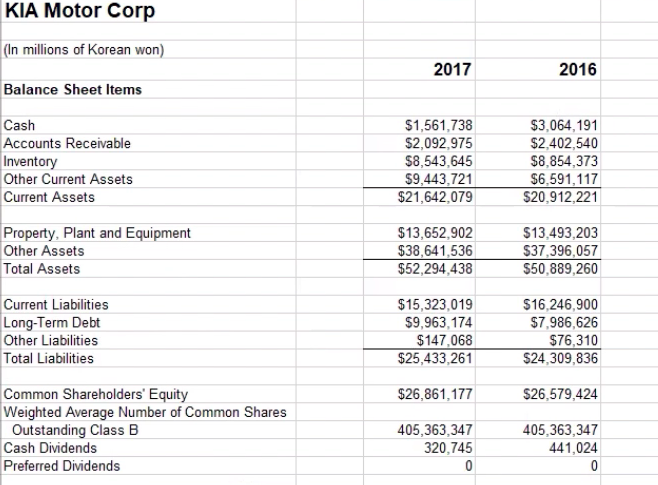
1. Use the template to do the ratio analysis. Note that the template is only for two years. 2. Choose a public company and get the most recent five years of financial statements 3. Do the financial ratio analysis using these five years of info. Note that you might need to compress (add) some of the items together to get to the format used in the template. 4. Comment on the change of each ratio, using year to year change. If you don't know what it is, Google it. 5. At the end, make a final recommendation as to invest in this company. Why and Why not. Note: no more than one page in writing on this recommendation. KIA Motor Corp (In millions of Korean won) 2017 2016 Balance Sheet Items Cash Accounts Receivable Inventory Other Current Assets Current Assets $1,561,738 $2,092,975 $8,543,645 $9,443,721 $21,642,079 $3,064, 191 $2,402.540 $8,854,373 $6,591, 117 $20,912,221 Property, Plant and Equipment Other Assets Total Assets $13,652,902 $38,641,536 $52,294,438 $13,493,203 $37,396,057 $50,889,260 Current Liabilities Long-Term Debt Other Liabilities Total Liabilities $15,323,019 $9,963 174 $147,068 $25,433,261 $16,246,900 $7,986,626 $76,310 $24,309,836 $26,861,177 $26,579,424 Common Shareholders' Equity Weighted Average Number of Common Shares Outstanding Class B Cash Dividends Preferred Dividends 405,363,347 320,745 0 405,363,347 441,024 0 Working Capital Current Assets - Current Liabilities $6,319,060 Current Ratio 1.41:1 Current Assets Current Liabilities $21.642.079 $15,323,019 Inventory Turnover N/A Cost of Goods Sold Average Inventory+ Days in Inventory = N/A 365 Days Inventory Turnover Receivables Turnover 23.82 times Net Credit Sales Average Gross Accounts Receivable $53.535.680 $2,247,758 Average Collection Period 365 Days Receivable Turnover Ratio 365 Days 23.82 15.32 days Operating Cycle Days to Sell Inventory + Collection Period days Debt to Total Assets = 49% Total Liabilities Total Assets $25.433 261 $52.294,438 Cash provided (used) by operating activities - Net Capital Expenditures - Dividends Paid Free Cash Flow ($2 200 376)
Step by Step Solution
There are 3 Steps involved in it

Get step-by-step solutions from verified subject matter experts