

Question: Here is the excel document needed. https://drive.google.com/file/d/0B9xkPklhNx9TUm01NFJuRXk5OEE/view?usp=sharing This assignment requires for you to do some readings and research on the use and mechanics of Microsoft's
Here is the excel document needed. https://drive.google.com/file/d/0B9xkPklhNx9TUm01NFJuRXk5OEE/view?usp=sharing
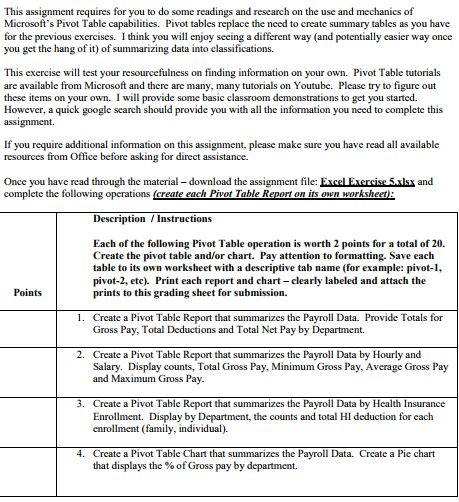
This assignment requires for you to do some readings and research on the use and mechanics of Microsoft's Pivot Table capabilities. Pivot tables replace the need to create summary tables as you have for the previous exercises. I think you will enjoy seeing a different way (and potentially easier way once you get the hang of it) of summarizing data into classifications. This exercise will test your resourcefulness on finding information on your own. Pivot Table tutorials are available from Microsoft and there are many, many tutorials on Youtube. Please try to figure out these items on your own. I will provide some basic classroom demonstrations to get you started. However, a quick google search should provide you with all the information you need to complete this assignment. If you require additional infomation on this assignment, please make sure you have read all available resources from Office before asking for direct assistance and Once you have read through the material - download the assignment file: Excel Exercise 5xl complete the following operations (create each Pivot Table Report on its own worksheet DescriptionInstructions Each of the following Pivot Table operation is worth 2 points for a total of 20. Create the pivot table and/or chart. Pay attention to formatting. Save each table to its own worksheet with a descriptive tab name (for example: pivot-1, pivot-2, etc). Print each report and chart -clearly labeled and attach the prints to this grading sheet for submission. Points 1. Create a Pivot Table Report that summarizes the Payroll Data. Provide Totals for Gross Pay, Total Deductions and Total Net Pay by Department. 2. Create a Pivot Table Report that summarizes the Payroll Data by Hourly and Salary. Display counts, Total Gross Pay, Minimum Gross Pay, Average Gross Pay and Maximum Gross Pay 3. Create a Pivot Table Report that summarizes the Payroll Data by Health Insurance Enrollment. Display by Department, the counts and total HI deduction for cach enrollment (family, individual) 4. Create a Pivot Table Chart that summarizes the Pavroll Data. Create a Pie chart that displays the % of Gross pay by department
Step by Step Solution
There are 3 Steps involved in it

Get step-by-step solutions from verified subject matter experts