

Question: Here is the excel link https://docs.google.com/spreadsheets/d/1pba8nBPSkogGwJBmzBeckIXwBbXRIfZrf7hbADBS8iw/htmlview 9. Use the sheets of RM RF and Q9_Industry Portfolios from the file Data.xlsx. There are 9 industry portfolios,
Here is the excel link
https://docs.google.com/spreadsheets/d/1pba8nBPSkogGwJBmzBeckIXwBbXRIfZrf7hbADBS8iw/htmlview
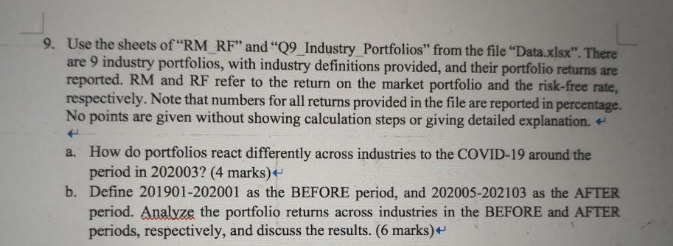
9. Use the sheets of "RM RF" and "Q9_Industry Portfolios" from the file "Data.xlsx". There are 9 industry portfolios, with industry definitions provided, and their portfolio returns are reported. RM and RF refer to the return on the market portfolio and the risk-free rate, respectively. Note that numbers for all returns provided in the file are reported in percentage. No points are given without showing calculation steps or giving detailed explanation. a. How do portfolios react differently across industries to the COVID-19 around the period in 202003? (4 marks)+ b. Define 201901-202001 as the BEFORE period, and 202005-202103 as the AFTER period. Analyze the portfolio returns across industries in the BEFORE and AFTER periods, respectively, and discuss the results. (6 marks) +
Step by Step Solution
There are 3 Steps involved in it

Get step-by-step solutions from verified subject matter experts