

Question: here is the question, the code included is just to provide data no need to run the code Question 4. Investigators selected 12 students from
here is the question, the code included is just to provide data
no need to run the code
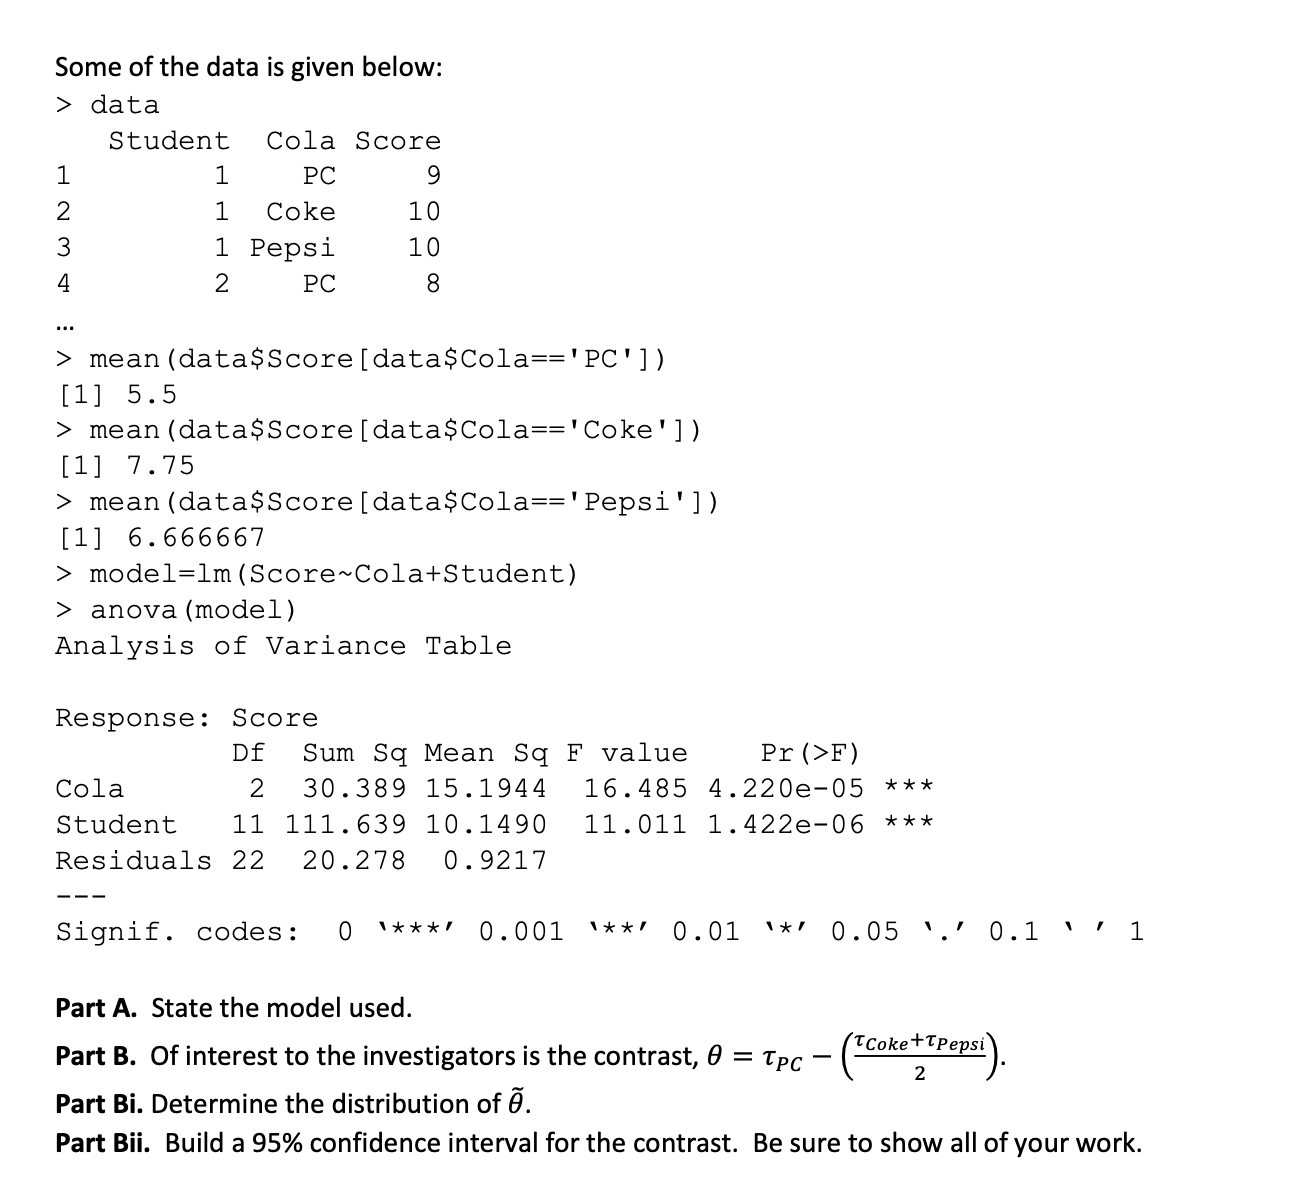
Question 4. Investigators selected 12 students from UWaterloo and randomly assigned them to either a PC cola, Coke or Pepsi. The students would then drink and score the cola based on taste. The score was an integer from 1 to 10. The students were then given another cola at random and asked to score it. They then were assigned to the last cola and asked to score it. Some of the data is given below: > data Student Cola Score PC 9 D W Coke 10 1 Pepsi 10 N PC 8 > mean (data$Score [data$Cola=='PC' ]) [1] 5.5 > mean (data$Score [data$Cola=='Coke' ]) [1] 7. 75 > mean (data$Score [data$Cola==' Pepsi' ]) [1] 6. 666667 > model=1m (Score~Cola+Student) > anova (model) Analysis of Variance Table Response: Score Df Sum Sq Mean Sq F value Pr (>F) Cola 2 30.389 15. 1944 16. 485 4. 220e-05 * * * Student 11 111 . 639 10.1490 11. 011 1. 422e-06 * * * Residuals 22 20.278 0. 9217 Signif. codes: 0 ' * **' 0.001 \\**/ 0. 01 \\ * 0. 05 .' 0.1 / 1 Part A. State the model used. Part B. Of interest to the investigators is the contrast, 0 = Tpc - ICoke +TPepsi 2 Part Bi. Determine the distribution of 0. Part Bii. Build a 95% confidence interval for the contrast. Be sure to show all of your work
Step by Step Solution
There are 3 Steps involved in it

Get step-by-step solutions from verified subject matter experts