

Question: Here is the task I need help with: Update the End-User Satisfaction sheet. Aggregate this data by score and market. (Use Pivot tables.) (Note: Remember
Here is the task I need help with:
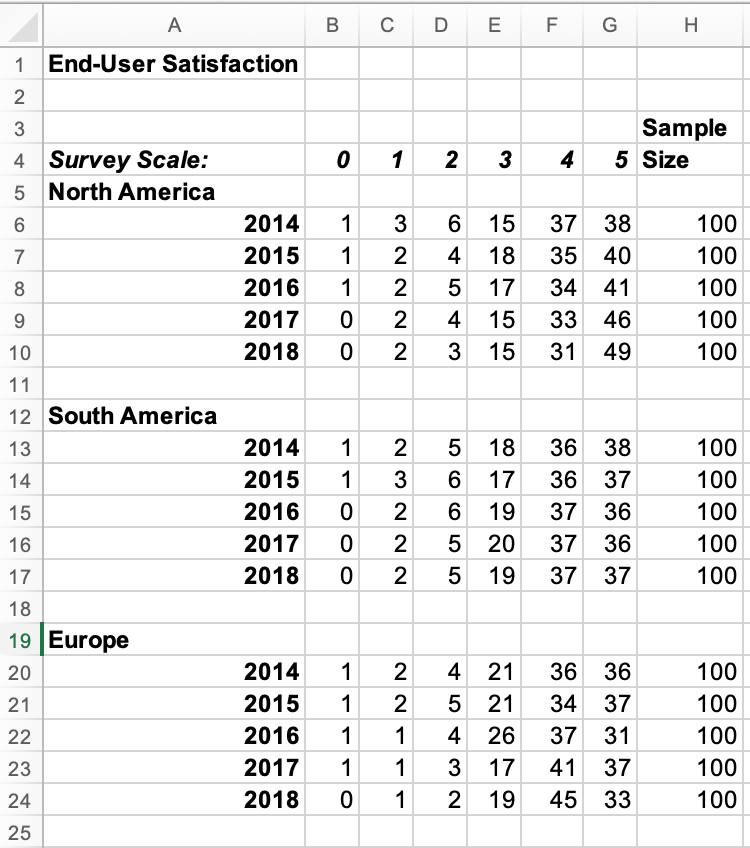
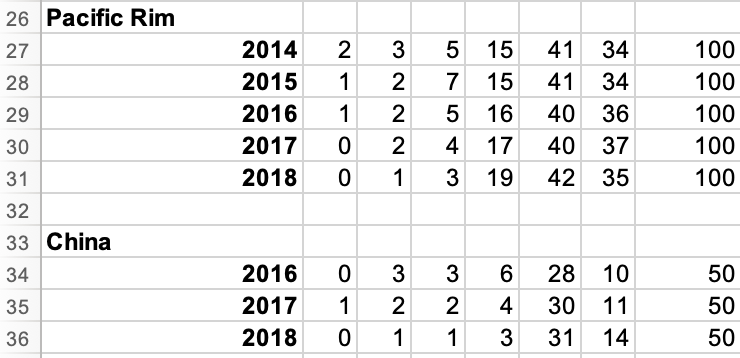
Update the End-User Satisfaction sheet. Aggregate this data by score and market. (Use Pivot tables.) (Note: Remember to reformat the data then convert it to a table.)
Please help I'm having a really hard time figuring out how to aggregate this data and create a pivot table.
D E F G H 1 End-User Satisfaction 0 1 2 3 4 Sample 5 Size 4 Survey Scale: 5 North America 2014 2015 2016 2017 2018 1 1 1 0 0 3 2 2 2 2 6 15 4 18 5 17 4 15 3 15 37 38 35 40 34 41 33 46 31 49 100 100 100 100 100 11 12 South America 13 14 15 16 2014 2015 2016 2017 2018 1 1 0 0 0 2 3 2 2 2 5 6 6 5 5 18 17 19 20 19 36 36 37 37 37 38 37 36 36 37 100 100 100 100 100 17 18 19 Europe 21 2014 2015 2016 2017 2018 1 1 1 1 0 2 2 1 1 1 4 5 4 3 2 21 21 26 17 19 36 36 34 37 37 31 41 37 45 33 100 100 100 100 100 26 Pacific Rim 100 2014 2015 2016 2017 2018 2 1 1 0 0 3 2 2 2 1 5 7 5 4 3 15 15 16 17 19 41 34 41 34 40 36 40 37 42 35 100 100 100 100 33 China 50 2016 2017 2018 0 1 0 3 2 1 3 2 1 6 4 3 28 30 31 10 11 14 50 50Step by Step Solution
There are 3 Steps involved in it
1 Expert Approved Answer
Step: 1 Unlock

Question Has Been Solved by an Expert!
Get step-by-step solutions from verified subject matter experts
Step: 2 Unlock
Step: 3 Unlock