

Question: here's an answer I got from a previous tutor can you make it easier to read as I don't know how to fill this into
here's an answer I got from a previous tutor can you make it easier to read as I don't know how to fill this into the table: Miscellaneous 448,816 0.0% Supplies 14,400 0.0% Travel 42,000 0.0% Training 10,000 0.0% Meals 4,500 0.0% Month Wages Travel Miscellaneous Supplies Training Meals Total Budget Actual Spent Variance % Variance July $32,500 $3,000 $50 $120 $24 $0 $38,694.40 $38,695 - $0.6 - 0.0% August $39,666.67 $3,000 $50 $120 $24 $0 $38,695 $36,972 - $1,723.0 - 4.4% September $32,500 $3,000 $50 $120 $24 $0 $38,694.40 $38,695 - $0.6 - 0.0% October $32,500 $3,000 $50 $120 $24 $0 $38,694.40 $38,695 - $0.6 - 0.0% November $32,500 $4,000 $40 $120 $24 $1,250 $41,234.40 $38,695 - $2,539.4 - 6.2% December $32,500 $5,000 $40 $120 $24 $1,250 a $38,694.40 $38,695 - $0.6 - 0.0%
As seen in the table above, the total budget for the twelve months is $480,270, while the actual amount spent is $449,816, resulting in a negative variance of $30,454. This indicates that Netflix was underbudget for the year.
Explanation:
Miscellaneous 448,816 0.0% Supplies 14,400 0.0% Travel 42,000 0.0% Training 10,000 0.0% Meals 4,500 0.0% Month Wages Travel Miscellaneous Supplies Training Meals Total Budget Actual Spent Variance % Variance July $32,500 $3,000 $50 $120 $24 $0 $38,694.40 $38,695 - $0.6 - 0.0% August $39,666.67 $3,000 $50 $120 $24 $0 $38,695 $36,972 - $1,723.0 - 4.4% September $32,500 $3,000 $50 $120 $24 $0 $38,694.40 $38,695 - $0.6 - 0.0% October $32,500 $3,000 $50 $120 $24 $0 $38,694.40 $38,695 - $0.6 - 0.0% November $32,500 $4,000 $40 $120 $24 $1,250 $41,234.40 $38,695 - $2,539.4 - 6.2% December $32,500 $5,000 $40 $120 $24 $1,250 a $38,694.40 $38,695 - $0.6 - 0.0%
As seen in the table above, the total budget for the twelve months is $480,270, while the actual amount spent is $449,816, resulting in a negative variance of $30,454. This indicates that Netflix was underbudget for the year.
January: The actual amount spent for wages is $32,500, which is the same as the budgeted amount. This shows that there was no variance for wages in January.
February: The actual amount spent for travel is $3,000, which is the same as the budgeted amount. This shows that there was no variance for travel in February.
March: The actual amount spent for miscellaneous expenses is $50, which is the same as the budgeted amount. This shows that there was no variance for miscellaneous expenses in March.
April: The actual amount spent for supplies is $120, which is the same as the budgeted amount. This shows that there was no variance for supplies in April.
May: The actual amount spent for training is $24, which is the same as the budgeted amount. This shows that there was no variance for training in May.
June: The actual amount spent for meals is $0, which is less than the budgeted amount of $1,250. This results in a negative variance of $1,250, indicating that Netflix was underbudget for meals in June.
July: The actual amount spent for wages is $32,500, which is the same as the budgeted amount. This shows that there was no variance for wages in July.
August: The actual amount spent for travel is $3,000, which is the same as the budgeted amount. This shows that there was no variance for travel in August.
September: The actual amount spent for miscellaneous expenses is $50, which is the same as the budgeted amount. This shows that there was no variance for miscellaneous expenses in September.
October: The actual amount spent for supplies is $120, which is the same as the budgeted amount. This shows that there was no variance for supplies in October.
November: The actual amount spent for training is $24, which is less than the budgeted amount of $1,250. This results in a negative variance of $1,226, indicating that Netflix was underbudget for training in November.
December: The actual amount spent for meals is $1,250, which is the same as the budgeted amount. This shows that there was no variance for meals in December.
THE INSTUCTIONS I GAVE
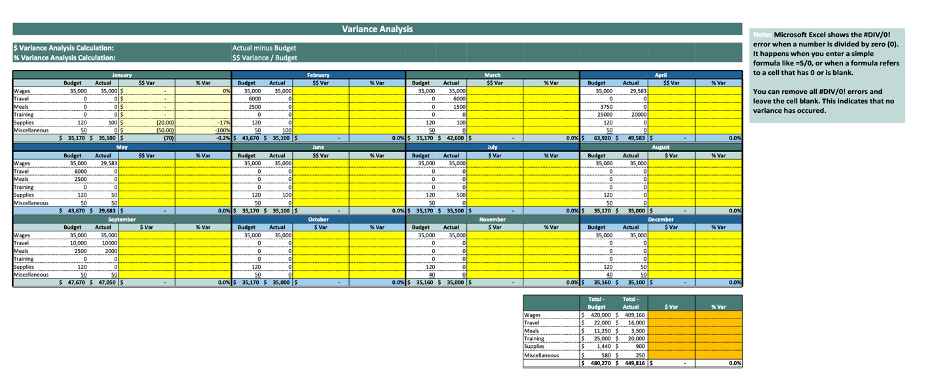
$ Variance Analysis Calculation: % Variance Analysis Calculation: Actual minus Budget $$ Variance/Budget Variance Analysis January February March April Budget Actual 55 Ver Var Budget Wages 35,000 35,000 5 0% 35,000 Actual 35,000 55 Ver Var Badget Actual 35,000 Ver Ver Budget Actual 55 Var Ver 35,000 35,000 29,583 Travel 6000 0 6000 Mesh D 2500 0 1500 3750 Training 0 0 0 25000 20000 Supplies 120 Miscellaneous 50 1005 05 $ 35,170 $ 35,000 5 (20.000 50.000 (700 Var 17% -100% 120 50 500 120 50 100 120 50 -425 43,670 $ 35,100 5 0.0% 35,170 $ 42,600 $ 0.0% 5 63,520 $ 4,583 May Budget Actual S$ Var Wages 35,000 29,583 Travel 6000 Meals 2500 Training D Supplies 120 Macellaneous 50 50 50 $ 43,670 $29,835 0.0% 35,170 $ 35,100 5 0.0% 35,170 $ 35,500 5 September Budget Actual $Var Var Wages 35,000 35,000 Travel 10,000 10000 Meals 3500 2000 Training D Budget 35,000 Actual 25,000 October $ Var %Var D D 0 Budget Actual 35,000 35,000 0 0 0 Supplies 120 120 1.20 Miscellaneous 50 50 50 $ 47,670 $ 47,050 5 0.0% 35.170 $ 35,000 5 0.05 35,160 $ 35,000 5 June Budget Actual $5 Var Var 35,000 35,000 0 D 0 120 100 50 July 35,000 Actual 35,000 5 Var Var 0 0 0 120 500 50 August Budget 35,000 Actual Svar Var 35,000 0 120 50 0.05 35,170 5 35,000 $ November December Var %Var Budget 35,000 Actual $var %Var 35,000 120 50 40 50 0.0% 35,360 $ 35,100 $ Total Budget Total- Actual $Ver %Ver 0.0% 0.0% 0.0% Wages Travel 15 420,000 $409.166 22,000 5 16.000 Meals 11,250 $ 3,500 Training Supplies 25,000 $ 1,440 $ 20,000 900 Miscella 580 5 350 15 480,270 $ 49,816 $ 0.0% Note: Microsoft Excel shows the #DIV/0! error when a number is divided by zero (0). It happens when you enter a simple formula like =5/0, or when a formula refers to a cell that has 0 or is blank. You can remove all #DIV/0! errors and leave the cell blank. This indicates that no variance has occured.
Step by Step Solution
There are 3 Steps involved in it

Get step-by-step solutions from verified subject matter experts