

Question: Here's some background info. The data below are from the 2018 General Social Survey. Respondents were asked if economic differences among racial groups were due
Here's some background info. The data below are from the 2018 General Social Survey. Respondents were asked if economic differences among racial groups were due to racial discrimination. Respondents who agreed were coded 1; respondents who disagreed were coded 2. Respondents were also asked with which racial/ethnic group they identified. Respondents who said "White were coded 1; respondents who said "Hispanic" were coded 2; respondents who said "Asian" were coded 3; respondents who said "Black" were given a value of 4. I'm confused how to find which variable is the independent and dependent variable? Please explain how to percentage the data in the table. Also calculate the row and column marginal percentages. What percentage of the respondents believe economic differences are due to racial discrimination? Which racial/ethnic category has the largest percentage? Please work by hand. I did not use stats software so I would not be able to understand.
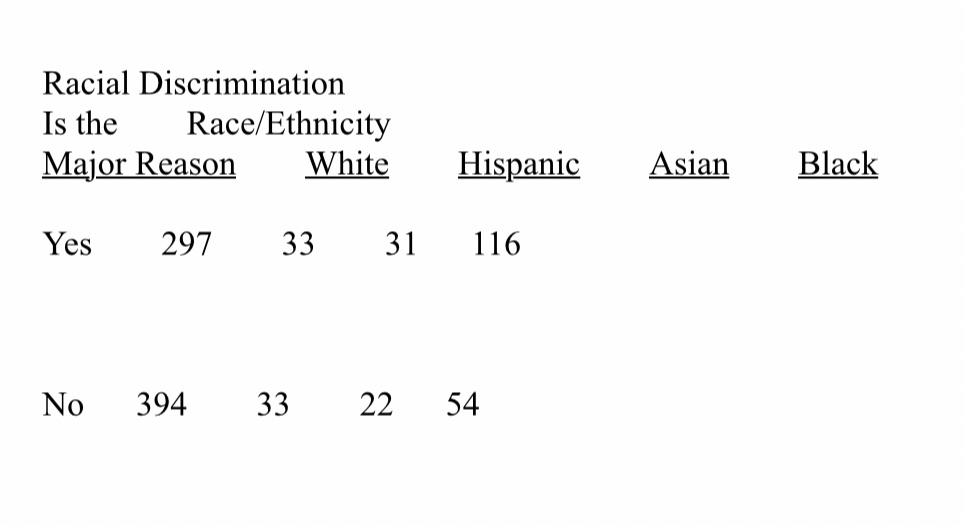
Racial Discrimination Is the Race/Ethnicity MOI Reason White Yes 297 33 31 No 394 33 22 Hispanic 116 54
Step by Step Solution
There are 3 Steps involved in it

Get step-by-step solutions from verified subject matter experts