

Question: Hey guys, I need help in a business case study about the K-DOW Petrochemical Joint Venture. The teacher is asking for arguments to qualify the
Hey guys, I need help in a business case study about the K-DOW Petrochemical Joint Venture.
The teacher is asking for arguments to qualify the potential deal in terms of valuation, potential benefits in terms of costs and sales, and any additional argument we might have to conclude that the deal is a good deal.
The info provided in the case:
Aditionally info:
JPMorgan wrote that the deal represents a $3.3 billion pretax premium to Dows market valuation.
Deutsche Bank similarly concluded that [KPC subsidiary] PIC is paying $9.5B...versus a market implied value of $6.0B.34 BB&T Capital Markets declared the deal a very nice value for Dow!35 In contrast, Investment Research declared the valuation to be appropriate based on EBITDA multiples, though the report did observe that [t]he value placed on the businesses contributed to the joint venture was...about 40% of the companys value but less than 25% of the revenue projected for 2007.
The deal is positive on many levels: It 1) reduces commodity exposure; 2) brings in cash; 3) is propitiously timed, coming before any significant impact from an industry downturn. The transactions timing is propitious, coming about a year ahead of what we believe will be a highly challenging period for commodity chemical products, as new commodity chemical capacity in the Middle East begins to ramp up; and 4) seems to be valued fairly.37
Data for M&A deals in the chemicals industry show that EBITDA multiples trended upward until August 2007, reaching a peak of approximately 11.0, then dropped as low as 5.0 during the 2008-2009 financial crisis before rebounding to 10+ in the aftermath of the crisis (Exhibit 10). In the case of the K-Dow JV, taking an approximate $19 billion valuation for the deal
Can you please help me in how we could argument about valuation and any other adittional value that might help us to conclude the deal is good?
Thnaks
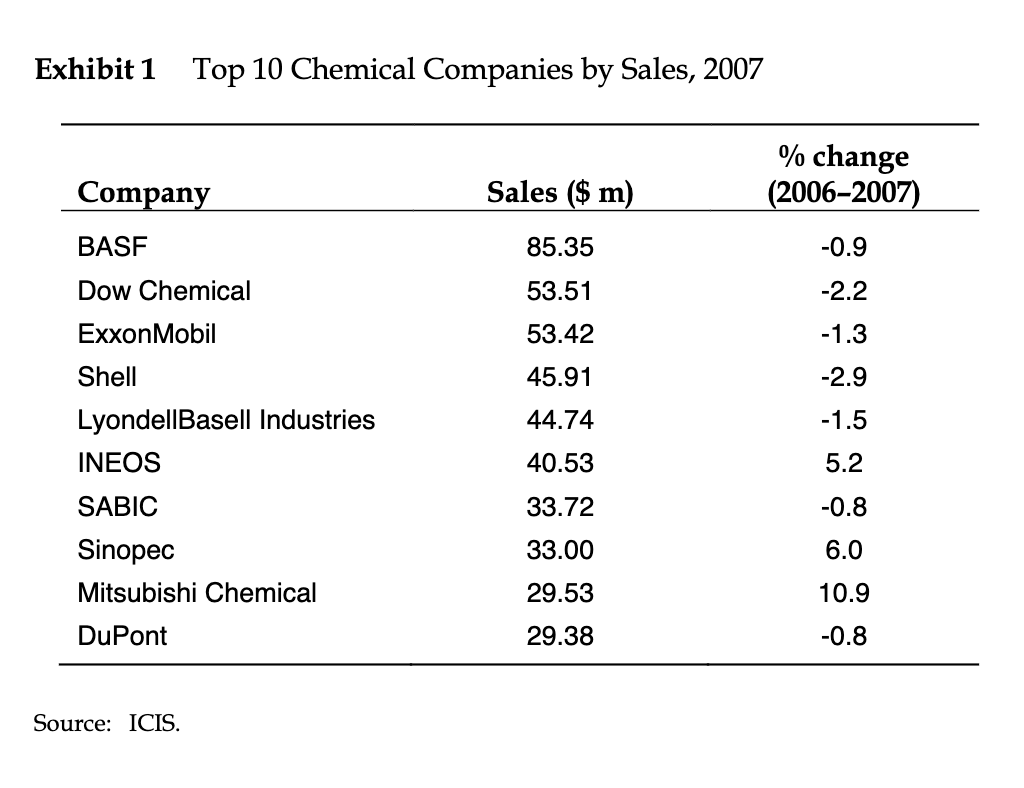
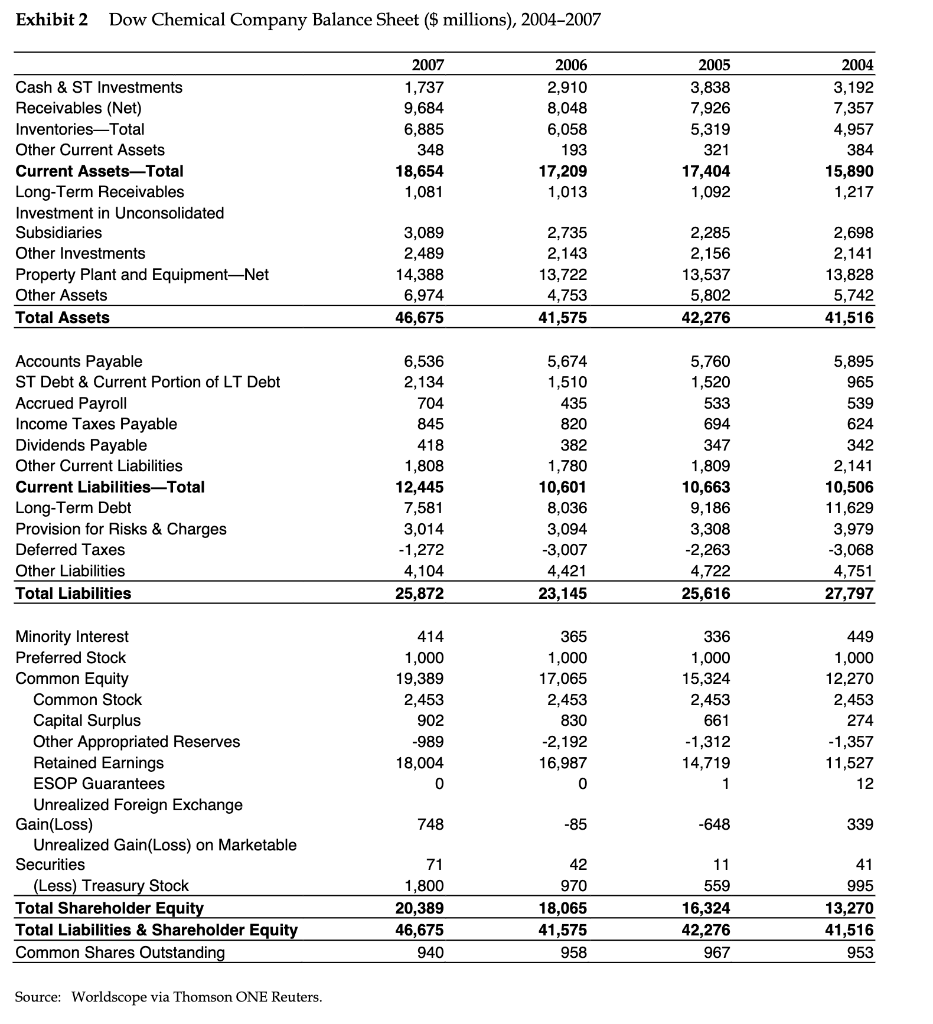
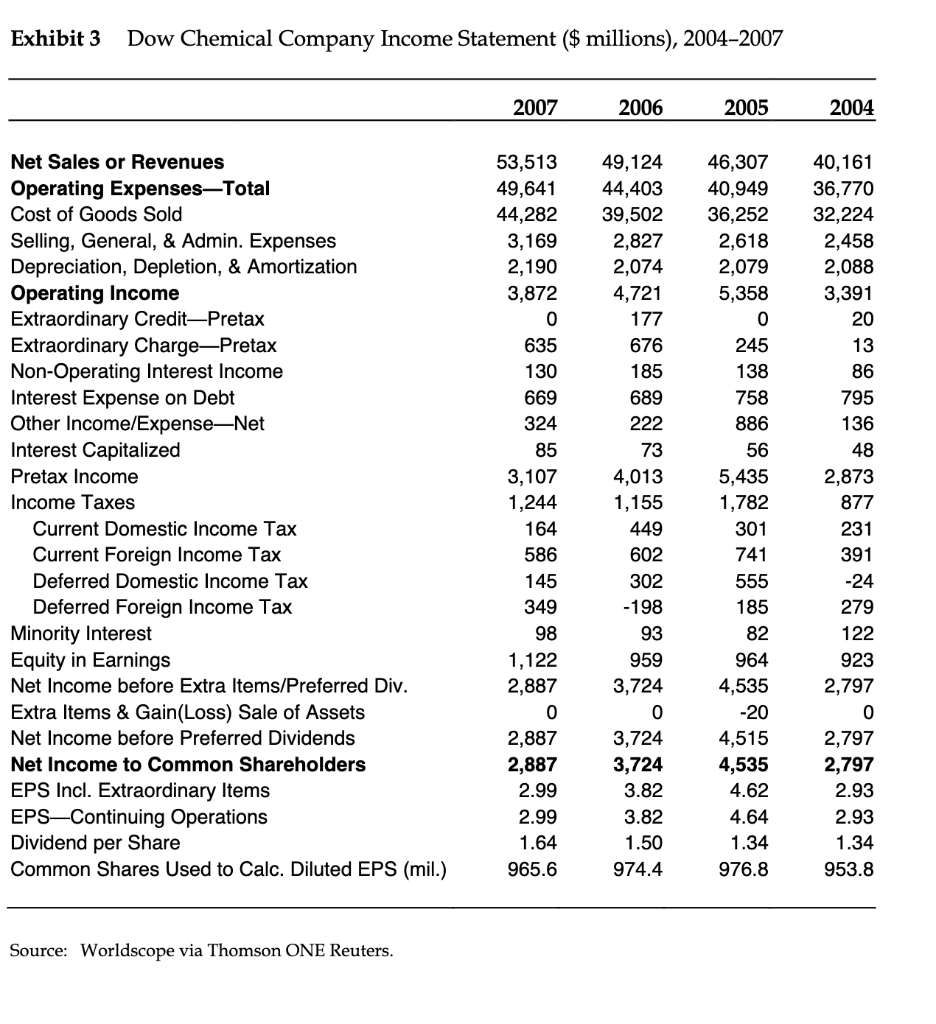
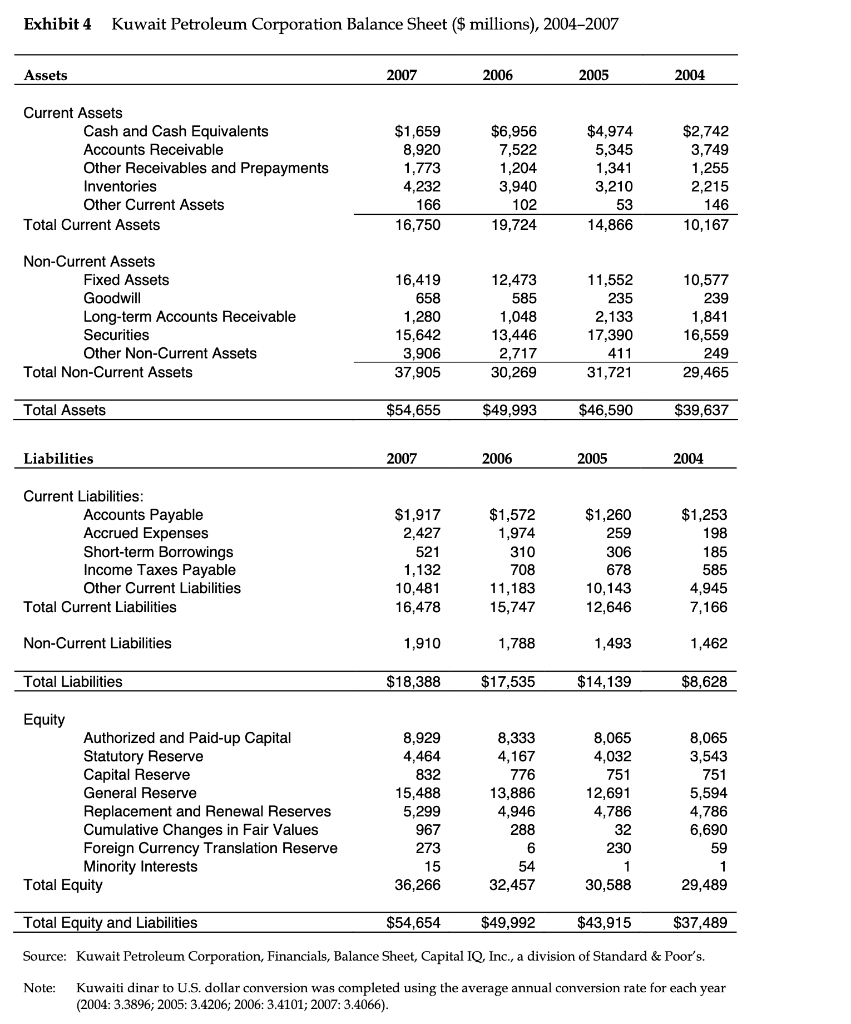
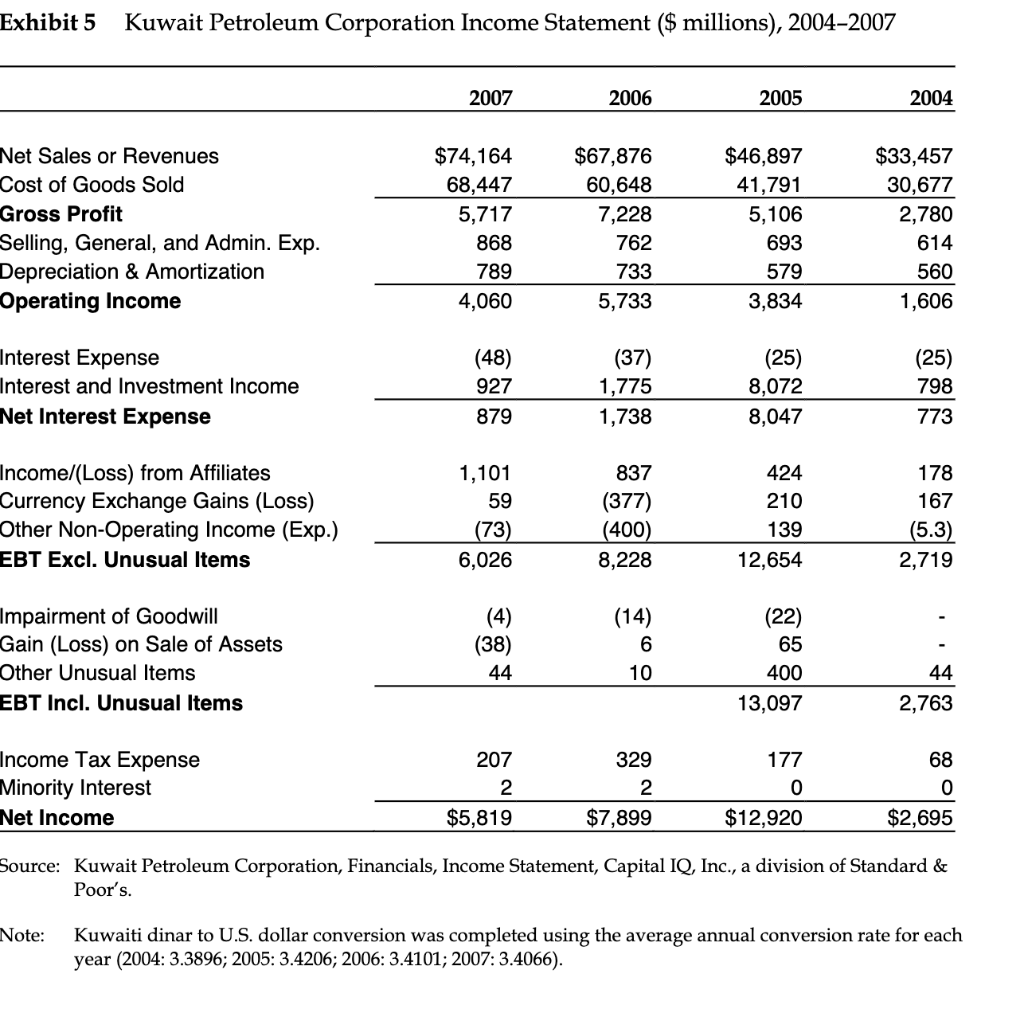
Exhibit 1 Top 10 Chemical Companies by Sales, 2007 % change (2006-2007) Company Sales ($ m) BASF 85.35 -0.9 53.51 -2.2 53.42 -1.3 Dow Chemical ExxonMobil Shell LyondellBasell Industries INEOS 45.91 -2.9 44.74 -1.5 0.53 .2 33.72 -0.8 SABIC Sinopec Mitsubishi Chemical 33.00 6.0 29.53 10.9 DuPont 29.38 -0.8 Source: ICIS. Exhibit 2 Dow Chemical Company Balance Sheet ($ millions), 2004-2007 2007 1,737 9,684 2004 3,192 7,357 6,885 2006 2,910 8,048 6,058 193 17,209 1,013 2005 3,838 7,926 5,319 321 17,404 1,092 4,957 348 18,654 1,081 384 15,890 1,217 Cash & ST Investments Receivables (Net) Inventories-Total Other Current Assets Current Assets-Total Long-Term Receivables Investment in Unconsolidated Subsidiaries Other Investments Property Plant and Equipment-Net Other Assets Total Assets 3,089 2,489 14,388 6,974 46,675 2,735 2,143 13,722 4,753 41,575 2,285 2,156 13,537 5.802 42,276 2,698 2,141 13,828 5,742 41,516 Accounts Payable ST Debt & Current Portion of LT Debt Accrued Payroll Income Taxes Payable Dividends Payable Other Current Liabilities Current LiabilitiesTotal Long-Term Debt Provision for Risks & Charges Deferred Taxes Other Liabilities Total Liabilities 6,536 2,134 704 845 418 1,808 12,445 7,581 3,014 -1,272 4,104 25,872 5,674 1,510 435 820 382 1,780 10,601 8,036 3,094 -3,007 4,421 23,145 5,760 1,520 533 694 347 1,809 10,663 9,186 3,308 -2,263 4,722 25,616 5,895 965 539 624 342 2,141 10,506 11,629 3,979 -3,068 4,751 27,797 414 1,000 19,389 2,453 902 -989 18,004 0 365 1,000 17,065 2,453 830 -2,192 16,987 0 336 1,000 15,324 2,453 661 -1,312 14,719 1 449 1,000 12,270 2,453 274 -1,357 11,527 12 Minority Interest Preferred Stock Common Equity Common Stock Capital Surplus Other Appropriated Reserves Retained Earnings ESOP Guarantees Unrealized Foreign Exchange Gain(Loss) Unrealized Gain(Loss) on Marketable Securities (Less) Treasury Stock Total Shareholder Equity Total Liabilities & Shareholder Equity Common Shares Outstanding 748 -85 -648 339 71 1,800 20,389 46,675 42 970 18,065 41,575 958 11 559 16,324 42,276 967 41 995 13,270 41,516 953 940 Source: Worldscope via Thomson ONE Reuters. Exhibit 3 Dow Chemical Company Income Statement ($ millions), 2004-2007 2007 2006 2005 2004 Net Sales or Revenues Operating Expenses-Total Cost of Goods Sold Selling, General, & Admin. Expenses Depreciation, Depletion, & Amortization Operating Income Extraordinary Credit-Pretax Extraordinary ChargePretax Non-Operating Interest Income Interest Expense on Debt Other Income/ExpenseNet Interest Capitalized Pretax Income Income Taxes Current Domestic Income Tax Current Foreign Income Tax Deferred Domestic Income Tax Deferred Foreign Income Tax Minority Interest Equity in Earnings Net Income before Extra Items/Preferred Div. Extra Items & Gain(Loss) Sale of Assets Net Income before Preferred Dividends Net Income to Common Shareholders EPS Incl. Extraordinary Items EPSContinuing Operations Dividend per Share Common Shares Used to Calc. Diluted EPS (mil.) 53,513 49,641 44,282 3,169 2,190 3,872 0 635 130 669 324 85 3,107 1,244 164 586 145 349 98 1,122 2,887 0 2,887 2,887 2.99 2.99 1.64 965.6 49,124 44,403 39,502 2,827 2,074 4,721 177 676 185 689 222 73 4,013 1,155 449 602 302 -198 93 959 3,724 0 3,724 3,724 3.82 3.82 1.50 974.4 46,307 40,949 36,252 2,618 2,079 5,358 0 245 138 758 886 56 5,435 1,782 301 741 555 185 82 964 4,535 -20 4,515 4,535 4.62 4.64 1.34 976.8 40,161 36,770 32,224 2,458 2,088 3,391 20 13 86 795 136 48 2,873 877 231 391 -24 279 122 923 2,797 0 2,797 2,797 2.93 2.93 1.34 953.8 Source: Worldscope via Thomson ONE Reuters. Exhibit 4 Kuwait Petroleum Corporation Balance Sheet ($ millions), 2004-2007 Assets 2007 2006 2005 2004 Current Assets Cash and Cash Equivalents Accounts Receivable Other Receivables and Prepayments Inventories Other Current Assets Total Current Assets $1,659 8,920 1,773 4,232 166 16,750 $6,956 7,522 1,204 3,940 102 19,724 $4,974 5,345 1,341 3,210 53 14,866 $2,742 3,749 1,255 2,215 146 10,167 Non-Current Assets Fixed Assets Goodwill Long-term Accounts Receivable Securities Other Non-Current Assets Total Non-Current Assets 16,419 658 1,280 15,642 3,906 37,905 12,473 585 1,048 13,446 2,717 30,269 11,552 235 2,133 17,390 411 31,721 10,577 239 1,841 16,559 249 29,465 Total Assets $54,655 $49,993 $46,590 $39,637 Liabilities 2007 2006 2005 2004 Current Liabilities: Accounts Payable Accrued Expenses Short-term Borrowings Income Taxes Payable Other Current Liabilities Total Current Liabilities $1,917 2,427 521 1,132 10,481 16,478 $1,572 1,974 310 708 11,183 15,747 $1,260 259 306 678 10,143 12,646 $1,253 198 185 585 4,945 7,166 Non-Current Liabilities 1,910 1,788 1,493 1,462 Total Liabilities $18,388 $17,535 $14,139 $8,628 Equity Authorized and Paid-up Capital Statutory Reserve Capital Reserve General Reserve Replacement and Renewal Reserves Cumulative changes in Fair Values Foreign Currency Translation Reserve Minority Interests Total Equity 8,929 4,464 832 15,488 5,299 967 273 15 36,266 8,333 4,167 776 13,886 4,946 288 6 54 32,457 8,065 4,032 751 12,691 4,786 32 230 1 30,588 8,065 3,543 751 5,594 4,786 6,690 59 1 29,489 Total Equity and Liabilities $54,654 $49,992 $43,915 $37,489 Source: Kuwait Petroleum Corporation, Financials, Balance Sheet, Capital IQ, Inc., a division of Standard & Poor's. Note: Kuwaiti dinar to U.S. dollar conversion was completed using the average annual conversion rate for each year (2004: 3.3896; 2005: 3.4206; 2006: 3.4101; 2007: 3.4066). Exhibit 5 Kuwait Petroleum Corporation Income Statement ($ millions), 2004-2007 2007 2006 2005 2004 Net Sales or Revenues Cost of Goods Sold Gross Profit Selling, General, and Admin. Exp. Depreciation & Amortization Operating Income $74,164 68,447 5,717 868 789 4,060 $67,876 60,648 7,228 762 733 5,733 $46,897 41,791 5,106 693 579 3,834 $33,457 30,677 2,780 614 560 1,606 Interest Expense Interest and Investment Income Net Interest Expense (48) 927 879 (37) 1,775 1,738 (25) 8,072 8,047 (25) 798 773 Income/(Loss) from Affiliates Currency Exchange Gains (Loss) Other Non-Operating Income (Exp.) EBT Excl. Unusual Items 1,101 59 (73) 6,026 837 (377) (400) 8,228 424 210 139 12,654 178 167 (5.3) 2,719 Impairment of Goodwill Gain (Loss) on Sale of Assets Other Unusual Items EBT Incl. Unusual Items (4) (38) 44 (14) 6 10 (22) 65 400 13,097 44 2,763 Income Tax Expense Minority Interest Net Income 207 2 $5,819 329 2 $7,899 177 0 68 0 $2,695 $12,920 Source: Kuwait Petroleum Corporation, Financials, Income Statement, Capital IQ, Inc., a division of Standard & Poor's. Note: Kuwaiti dinar to U.S. dollar conversion was completed using the average annual conversion rate for each year (2004: 3.3896; 2005: 3.4206; 2006: 3.4101; 2007: 3.4066). Exhibit 1 Top 10 Chemical Companies by Sales, 2007 % change (2006-2007) Company Sales ($ m) BASF 85.35 -0.9 53.51 -2.2 53.42 -1.3 Dow Chemical ExxonMobil Shell LyondellBasell Industries INEOS 45.91 -2.9 44.74 -1.5 0.53 .2 33.72 -0.8 SABIC Sinopec Mitsubishi Chemical 33.00 6.0 29.53 10.9 DuPont 29.38 -0.8 Source: ICIS. Exhibit 2 Dow Chemical Company Balance Sheet ($ millions), 2004-2007 2007 1,737 9,684 2004 3,192 7,357 6,885 2006 2,910 8,048 6,058 193 17,209 1,013 2005 3,838 7,926 5,319 321 17,404 1,092 4,957 348 18,654 1,081 384 15,890 1,217 Cash & ST Investments Receivables (Net) Inventories-Total Other Current Assets Current Assets-Total Long-Term Receivables Investment in Unconsolidated Subsidiaries Other Investments Property Plant and Equipment-Net Other Assets Total Assets 3,089 2,489 14,388 6,974 46,675 2,735 2,143 13,722 4,753 41,575 2,285 2,156 13,537 5.802 42,276 2,698 2,141 13,828 5,742 41,516 Accounts Payable ST Debt & Current Portion of LT Debt Accrued Payroll Income Taxes Payable Dividends Payable Other Current Liabilities Current LiabilitiesTotal Long-Term Debt Provision for Risks & Charges Deferred Taxes Other Liabilities Total Liabilities 6,536 2,134 704 845 418 1,808 12,445 7,581 3,014 -1,272 4,104 25,872 5,674 1,510 435 820 382 1,780 10,601 8,036 3,094 -3,007 4,421 23,145 5,760 1,520 533 694 347 1,809 10,663 9,186 3,308 -2,263 4,722 25,616 5,895 965 539 624 342 2,141 10,506 11,629 3,979 -3,068 4,751 27,797 414 1,000 19,389 2,453 902 -989 18,004 0 365 1,000 17,065 2,453 830 -2,192 16,987 0 336 1,000 15,324 2,453 661 -1,312 14,719 1 449 1,000 12,270 2,453 274 -1,357 11,527 12 Minority Interest Preferred Stock Common Equity Common Stock Capital Surplus Other Appropriated Reserves Retained Earnings ESOP Guarantees Unrealized Foreign Exchange Gain(Loss) Unrealized Gain(Loss) on Marketable Securities (Less) Treasury Stock Total Shareholder Equity Total Liabilities & Shareholder Equity Common Shares Outstanding 748 -85 -648 339 71 1,800 20,389 46,675 42 970 18,065 41,575 958 11 559 16,324 42,276 967 41 995 13,270 41,516 953 940 Source: Worldscope via Thomson ONE Reuters. Exhibit 3 Dow Chemical Company Income Statement ($ millions), 2004-2007 2007 2006 2005 2004 Net Sales or Revenues Operating Expenses-Total Cost of Goods Sold Selling, General, & Admin. Expenses Depreciation, Depletion, & Amortization Operating Income Extraordinary Credit-Pretax Extraordinary ChargePretax Non-Operating Interest Income Interest Expense on Debt Other Income/ExpenseNet Interest Capitalized Pretax Income Income Taxes Current Domestic Income Tax Current Foreign Income Tax Deferred Domestic Income Tax Deferred Foreign Income Tax Minority Interest Equity in Earnings Net Income before Extra Items/Preferred Div. Extra Items & Gain(Loss) Sale of Assets Net Income before Preferred Dividends Net Income to Common Shareholders EPS Incl. Extraordinary Items EPSContinuing Operations Dividend per Share Common Shares Used to Calc. Diluted EPS (mil.) 53,513 49,641 44,282 3,169 2,190 3,872 0 635 130 669 324 85 3,107 1,244 164 586 145 349 98 1,122 2,887 0 2,887 2,887 2.99 2.99 1.64 965.6 49,124 44,403 39,502 2,827 2,074 4,721 177 676 185 689 222 73 4,013 1,155 449 602 302 -198 93 959 3,724 0 3,724 3,724 3.82 3.82 1.50 974.4 46,307 40,949 36,252 2,618 2,079 5,358 0 245 138 758 886 56 5,435 1,782 301 741 555 185 82 964 4,535 -20 4,515 4,535 4.62 4.64 1.34 976.8 40,161 36,770 32,224 2,458 2,088 3,391 20 13 86 795 136 48 2,873 877 231 391 -24 279 122 923 2,797 0 2,797 2,797 2.93 2.93 1.34 953.8 Source: Worldscope via Thomson ONE Reuters. Exhibit 4 Kuwait Petroleum Corporation Balance Sheet ($ millions), 2004-2007 Assets 2007 2006 2005 2004 Current Assets Cash and Cash Equivalents Accounts Receivable Other Receivables and Prepayments Inventories Other Current Assets Total Current Assets $1,659 8,920 1,773 4,232 166 16,750 $6,956 7,522 1,204 3,940 102 19,724 $4,974 5,345 1,341 3,210 53 14,866 $2,742 3,749 1,255 2,215 146 10,167 Non-Current Assets Fixed Assets Goodwill Long-term Accounts Receivable Securities Other Non-Current Assets Total Non-Current Assets 16,419 658 1,280 15,642 3,906 37,905 12,473 585 1,048 13,446 2,717 30,269 11,552 235 2,133 17,390 411 31,721 10,577 239 1,841 16,559 249 29,465 Total Assets $54,655 $49,993 $46,590 $39,637 Liabilities 2007 2006 2005 2004 Current Liabilities: Accounts Payable Accrued Expenses Short-term Borrowings Income Taxes Payable Other Current Liabilities Total Current Liabilities $1,917 2,427 521 1,132 10,481 16,478 $1,572 1,974 310 708 11,183 15,747 $1,260 259 306 678 10,143 12,646 $1,253 198 185 585 4,945 7,166 Non-Current Liabilities 1,910 1,788 1,493 1,462 Total Liabilities $18,388 $17,535 $14,139 $8,628 Equity Authorized and Paid-up Capital Statutory Reserve Capital Reserve General Reserve Replacement and Renewal Reserves Cumulative changes in Fair Values Foreign Currency Translation Reserve Minority Interests Total Equity 8,929 4,464 832 15,488 5,299 967 273 15 36,266 8,333 4,167 776 13,886 4,946 288 6 54 32,457 8,065 4,032 751 12,691 4,786 32 230 1 30,588 8,065 3,543 751 5,594 4,786 6,690 59 1 29,489 Total Equity and Liabilities $54,654 $49,992 $43,915 $37,489 Source: Kuwait Petroleum Corporation, Financials, Balance Sheet, Capital IQ, Inc., a division of Standard & Poor's. Note: Kuwaiti dinar to U.S. dollar conversion was completed using the average annual conversion rate for each year (2004: 3.3896; 2005: 3.4206; 2006: 3.4101; 2007: 3.4066). Exhibit 5 Kuwait Petroleum Corporation Income Statement ($ millions), 2004-2007 2007 2006 2005 2004 Net Sales or Revenues Cost of Goods Sold Gross Profit Selling, General, and Admin. Exp. Depreciation & Amortization Operating Income $74,164 68,447 5,717 868 789 4,060 $67,876 60,648 7,228 762 733 5,733 $46,897 41,791 5,106 693 579 3,834 $33,457 30,677 2,780 614 560 1,606 Interest Expense Interest and Investment Income Net Interest Expense (48) 927 879 (37) 1,775 1,738 (25) 8,072 8,047 (25) 798 773 Income/(Loss) from Affiliates Currency Exchange Gains (Loss) Other Non-Operating Income (Exp.) EBT Excl. Unusual Items 1,101 59 (73) 6,026 837 (377) (400) 8,228 424 210 139 12,654 178 167 (5.3) 2,719 Impairment of Goodwill Gain (Loss) on Sale of Assets Other Unusual Items EBT Incl. Unusual Items (4) (38) 44 (14) 6 10 (22) 65 400 13,097 44 2,763 Income Tax Expense Minority Interest Net Income 207 2 $5,819 329 2 $7,899 177 0 68 0 $2,695 $12,920 Source: Kuwait Petroleum Corporation, Financials, Income Statement, Capital IQ, Inc., a division of Standard & Poor's. Note: Kuwaiti dinar to U.S. dollar conversion was completed using the average annual conversion rate for each year (2004: 3.3896; 2005: 3.4206; 2006: 3.4101; 2007: 3.4066)
Step by Step Solution
There are 3 Steps involved in it

Get step-by-step solutions from verified subject matter experts