

Question: Hey I had 2 questions from a math problem I was stuck on. I'll post 3 screenshots, 1 of them is the data for the

Hey I had 2 questions from a math problem I was stuck on. I'll post 3 screenshots, 1 of them is the data for the problem and the other 2 are the problems I needed help on.
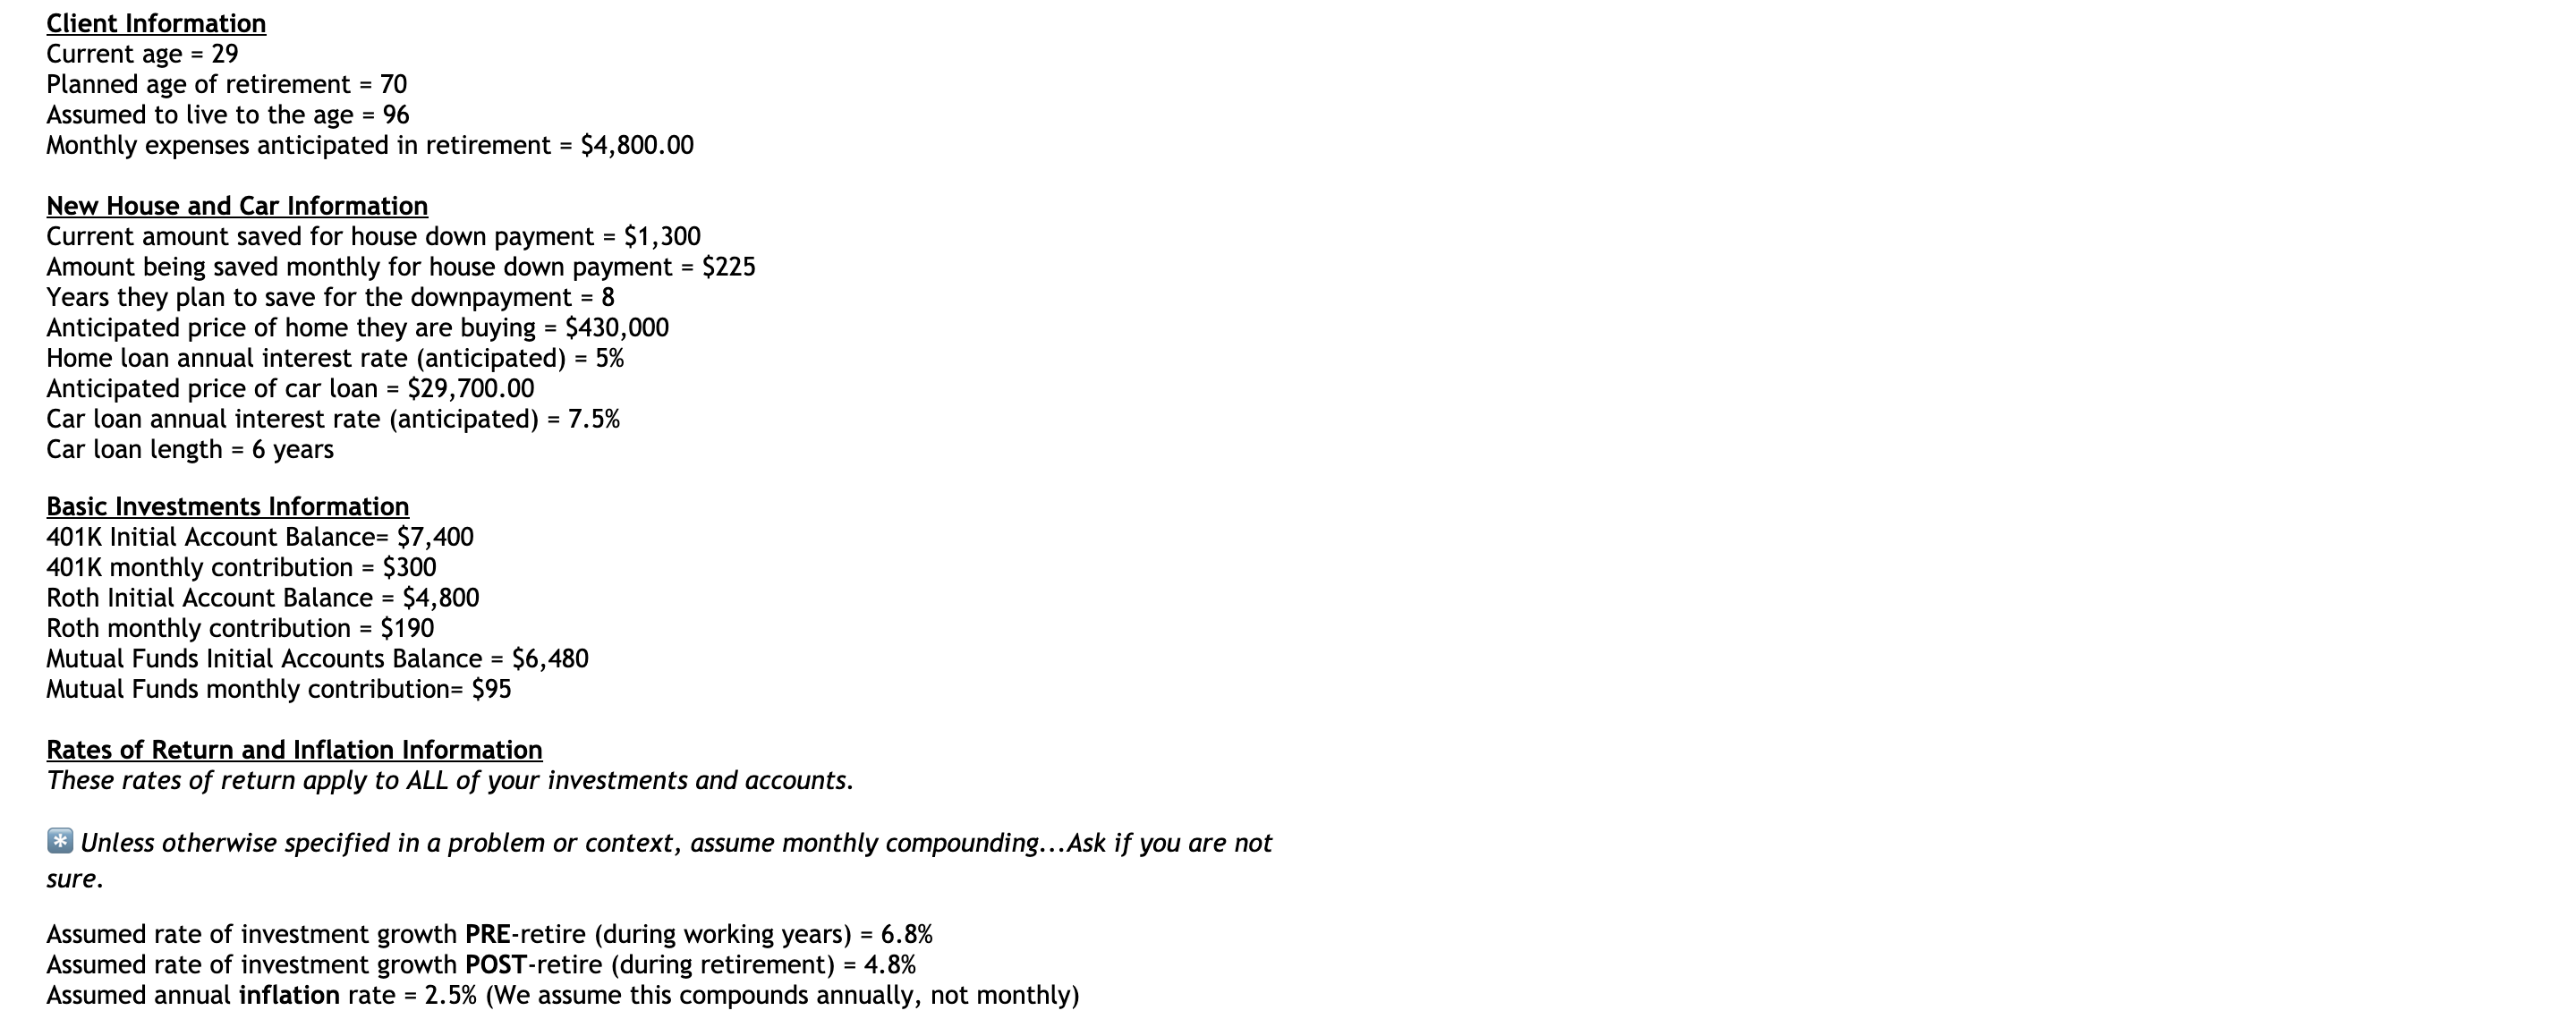
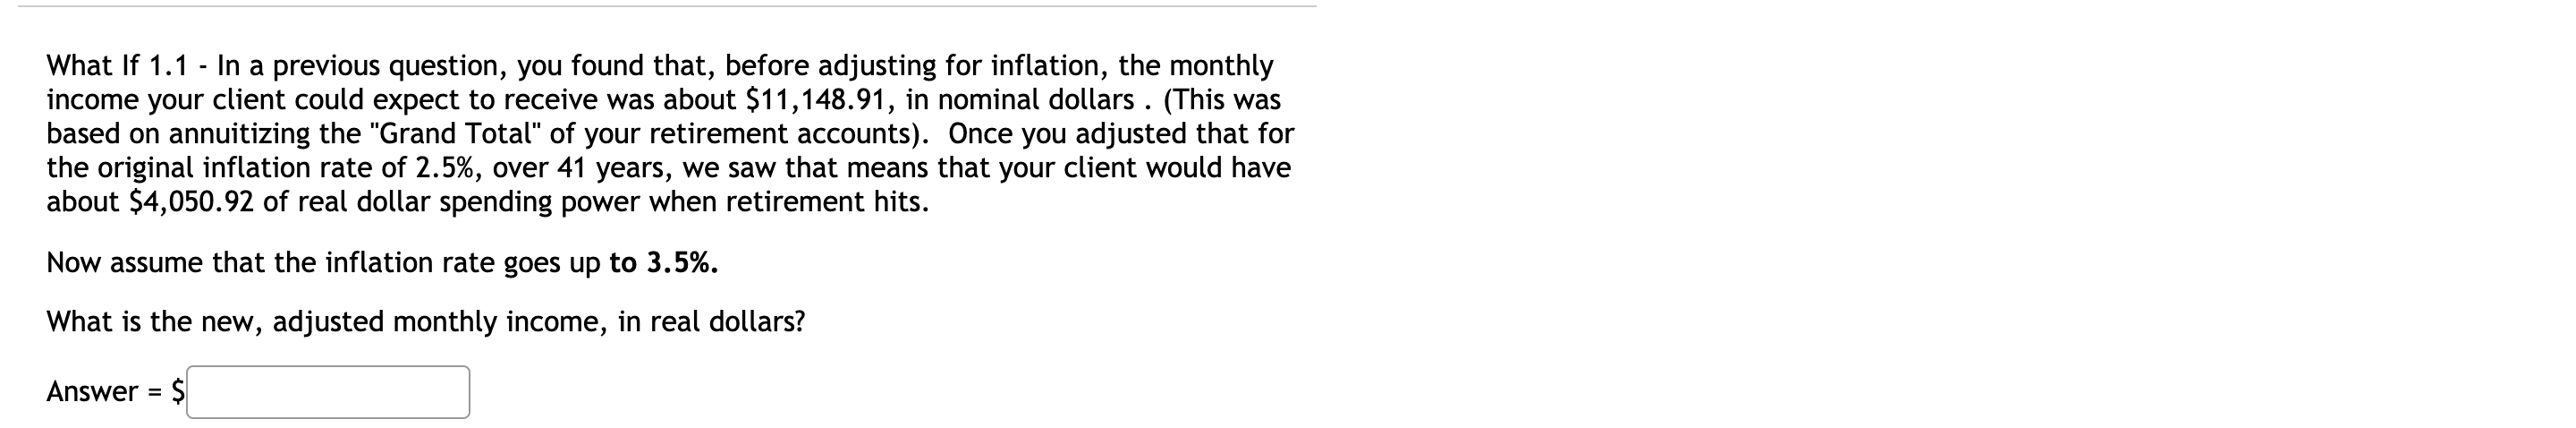

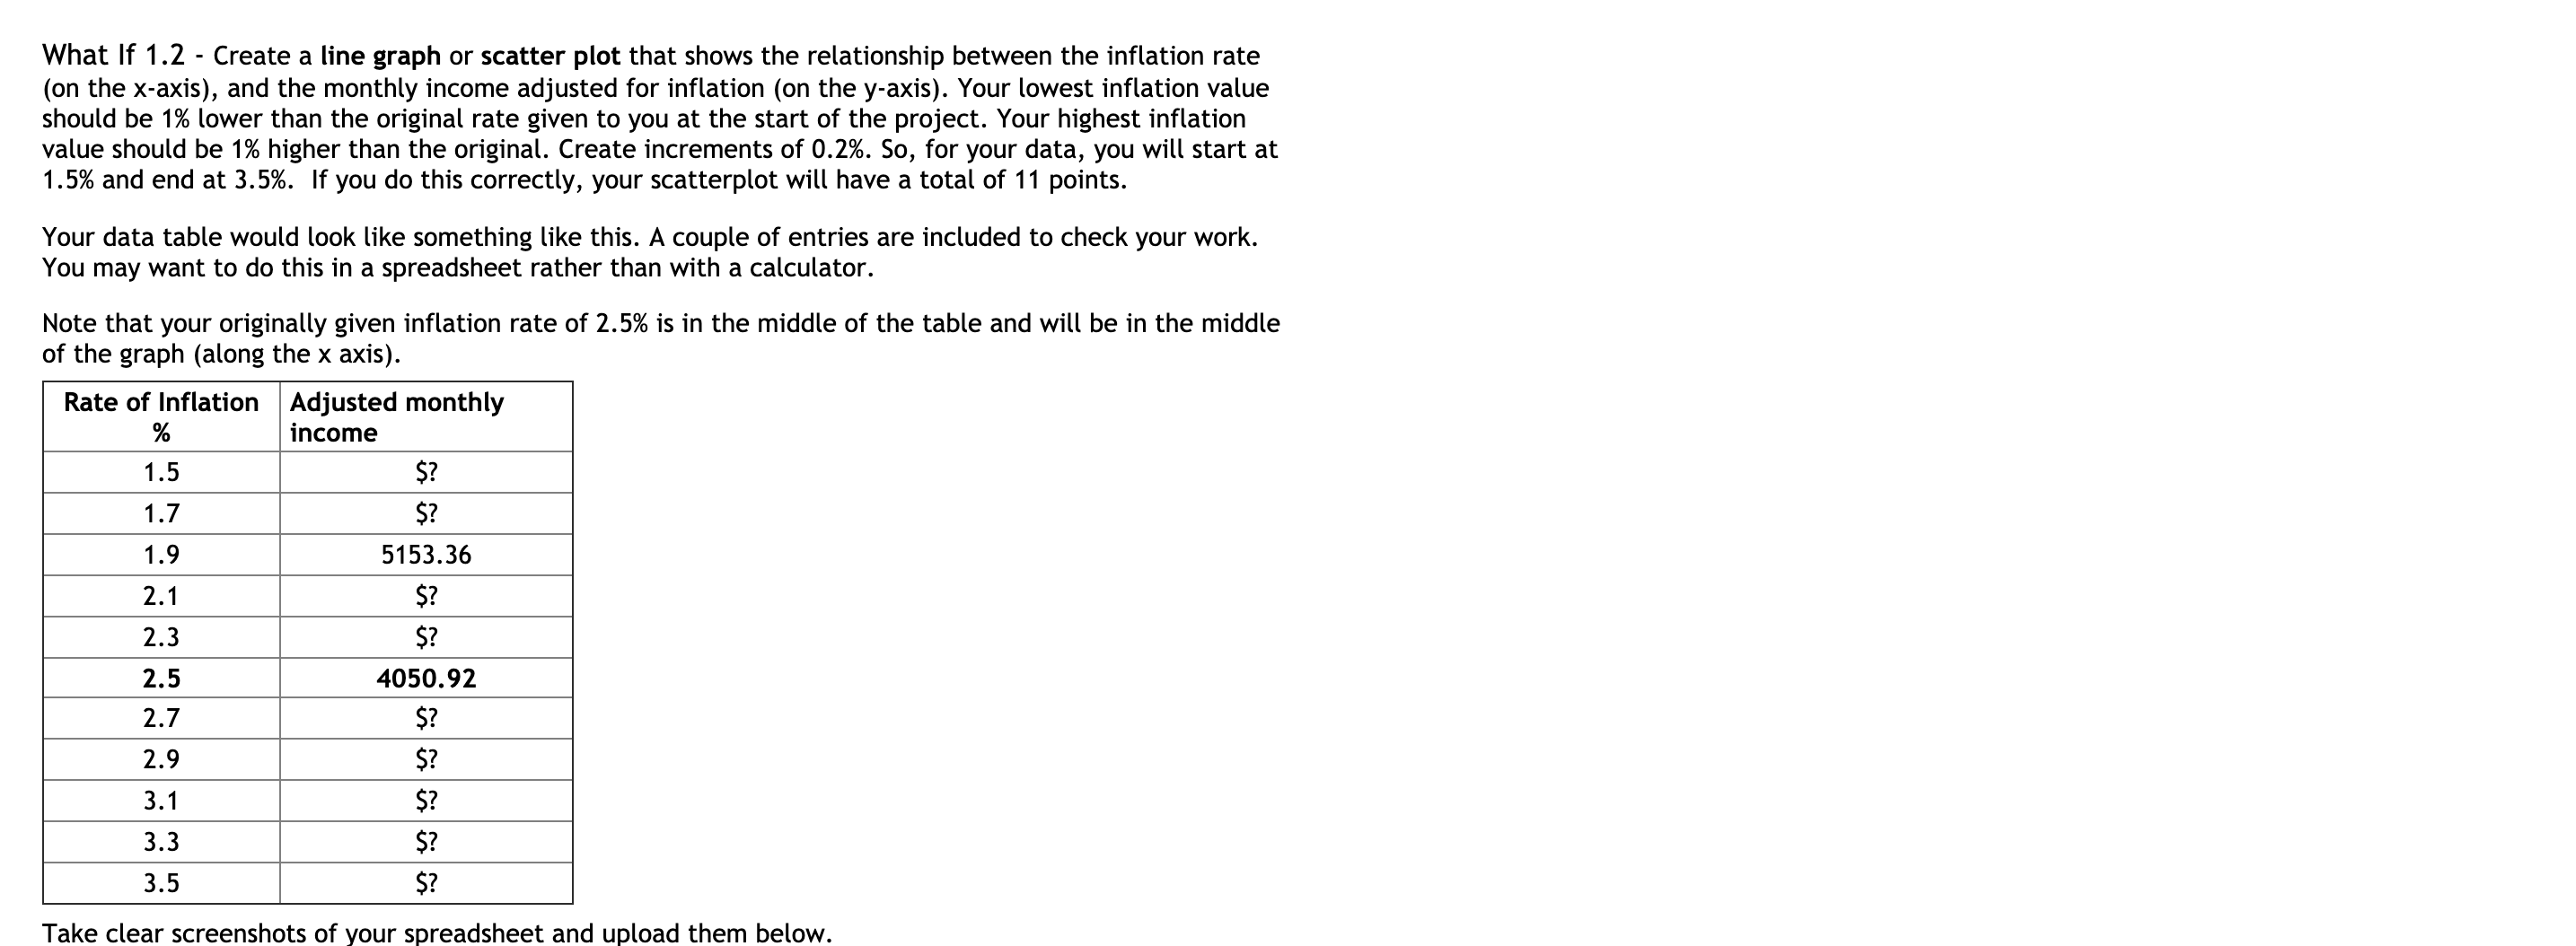
Client Information Current age = 29 Planned age of retirement = 70 Assumed to live to the age = 96 Monthly expenses anticipated in retirement = $4,800.00 New House and Car Information Current amount saved for house down payment = $1,300 Amount being saved monthly for house down payment = $225 Years they plan to save for the downpayment = 8 Anticipated price of home they are buying = $430,000 Home loan annual interest rate (anticipated) = 5% Anticipated price of car loan = $29,700.00 Car loan annual interest rate (anticipated) = 7.5% Car loan length = 6 years Basic Investments Information 401K Initial Account Balance= $7,400 401K monthly contribution = 5300 Roth Initial Account Balance = $4,800 Roth monthly contribution = $190 Mutual Funds Initial Accounts Balance = $6,480 Mutual Funds monthly contribution= $95 Rates of Return and Inflation Information These rates of return apply to ALL of your investments and accounts. a Unless otherwise specified in a problem or context, assume monthly compounding. ..Ask if you are not sure. Assumed rate of investment growth PRE-retire (during working years) = 6.8% Assumed rate of investment growth POST-retire (during retirement) = 4.8% Assumed annual inflation rate = 2.5% (We assume this compounds annually, not monthly) What If 1.1 - In a previous question, you found that, before adjusting for inflation, the monthly income your client could expect to receive was about $11,148.91, in nominal dollars . (This was based on annuitizing the "Grand Total" of your retirement accounts). Once you adjusted that for the original inflation rate of 2.5%, over 41 years, we saw that means that your client would have about $4,050.92 of real dollar spending power when retirement hits. Now assume that the inflation rate goes up to 3.5%. What is the new, adjusted monthly income, in real dollars? What If 1.2 - Create a line graph or scatter plot that shows the relationship between the inflation rate (on the x-axis), and the monthly income adjusted for inflation (on the y-axis). Your lowest ination value should be 1% lower than the original rate given to you at the start of the project. Your highest inflation value should be 1% higher than the original. Create incremenu of 0.2%. So, for your data, you will start at 1.5% and end at 3.5%. If you do this correctly, your scatterplot will have a total of 11 points. Your data table would look like something like this. A couple of entries are included to check your work. You may want to do this in a spreadsheet rather than with a calculator. Note that your originally given inflation rate of 2.5% is in the middle of the table and will be in the middle of the graph (along the x axis). Rate of Ination Adjusted monthly % income 1.5 S? 1.7 S? 1.9 5153.36 2.1 S? 2.3 S? 2.5 4050.92 2.7 S? 2.9 S? 3.1 S? 3.3 S? 3.5 S? Take clear screenshots of your spreadsheet and upload them below
Step by Step Solution
There are 3 Steps involved in it

Get step-by-step solutions from verified subject matter experts