

Question: Hey - I need help with this project, my instructor is known for not being very helpful and I have no idea what to do.
Hey - I need help with this project, my instructor is known for not being very helpful and I have no idea what to do. If you could please show how to calculate it on excel that would be great. Thank you!!
Stock Analysis: In this section, you will select five stocks from the provided list and determine their values by applying an appropriate valuation model from the following options: price to multiple model (earning or sales), dividend valuation model, or free cash flow to equity valuation model. A. Determine the value of each stock by using an appropriate model based on the characteristics provided for each stock; use each model at least once. C. Using the calculated valuation, the current market price, and historical performance, determine the expected return for each stock.
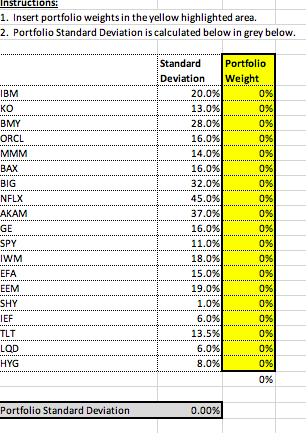
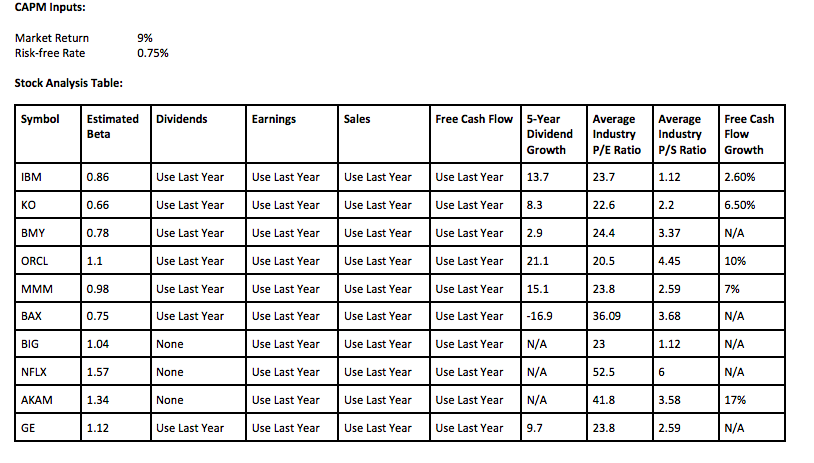
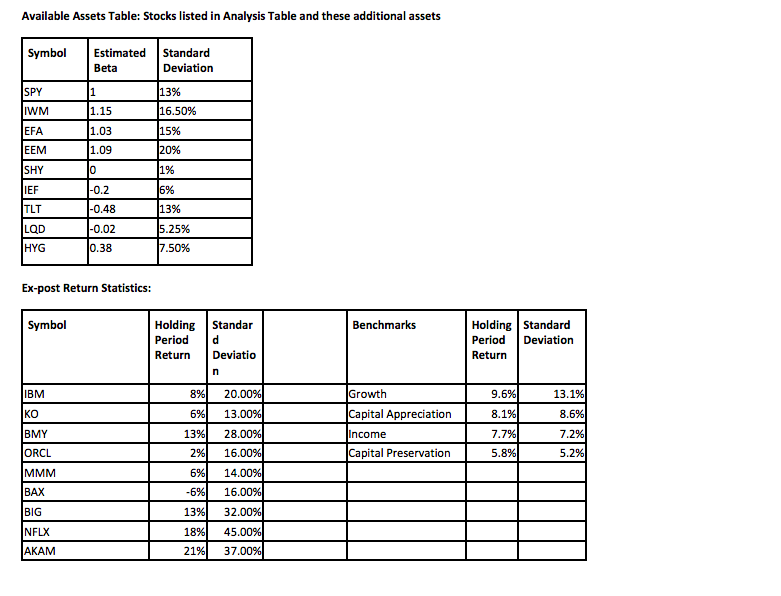
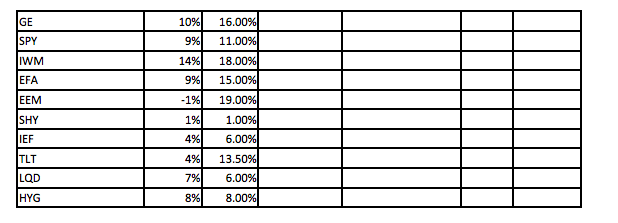
nstructions: 1. Insert portfolio weights in the yellow highlighted area. 2. Portfolio Standard Deviation is calculated below in grey below. IBM KO BMY ORCL MMM BAX BIG NFLX AKAM GE SPY IWM EFA EEM SHY IEF TLT LQD HYG Standard Portfolio Deviation Weight 20.0%) 0% 13.0% 0% 28.0% 0% 16.0% 0% 14.0% 096 16.0% 0% 32.0% 0% 45.0% 0% 37.0% 0% 16.0% 0% 11.0%) 0% 18.0% 0% 15.0% 0% 19.0% 0% 1.0% 0% 6.0% 0% 13.5% 0% 6.0% 0% 8.0% 0 0% 0% Portfolio Standard Deviation 0.00% CAPM Inputs: Market Return Risk-free Rate 9% 0.75% Stock Analysis Table: Symbol Dividends Estimated Beta Earnings Sales Free Cash Flow 5-Year Dividend Growth Average Industry P/E Ratio Average Industry P/S Ratio Free Cash Flow Growth IBM 0.86 Use Last Year Use Last Year Use Last Year 13.7 23.7 1.12 2.60% Use Last Year Use Last Year KO 0.66 Use Last Year Use Last Year Use Last Year 8.3 22.6 2.2 6.50% BMY 0.78 Use Last Year Use Last Year Use Last Year Use Last Year 2.9 24.4 3.37 N/A ORCL 1.1 Use Last Year Use Last Year Use Last Year Use Last Year 21.1 20.5 4.45 10% MMM 0.98 Use Last Year 15.1 23.8 2.59 7% Use Last Year Use Last Year BAX 0.75 Use Last Year 36.09 3.68 N/A BIG 1.04 None Use Last Year 23 1.12 N/A Use Last Year Use Last Year Use Last Year Use Last Year Use Last Year Use Last Year Use Last Year Use Last Year -16.9 Use Last Year N/A Use Last Year N/A Use Last Year N/A Use Last Year 9.7 NFLX 1.57 None 52.5 6 N/A AKAM 1.34 None Use Last Year Use Last Year Use Last Year 41.8 3.58 17% GE 1.12 Use Last Year 23.8 2.59 N/A Available Assets Table: Stocks listed in Analysis Table and these additional assets Symbol Estimated Beta Standard Deviation SPY 1 1.15 IWM EFA 13% 16.50% 15% 1.03 EEM 1.09 20% SHY 10 1% IEF -0.2 -0.48 6% 13% TLT LQD -0.02 5.25% 7.50% HYG 0.38 Ex-post Return Statistics: Symbol Benchmarks Holding Period Return Standar d Deviatio n Holding Standard Period Deviation Return IBM 8% 20.00% 9.6% 13.1% 8.6% KO 6% 13% 2% BMY Growth Capital Appreciation Income Capital Preservation 13.00% 28.00% 16.00% 8.1% 7.7% 5.8% 7.2% ORCL 5.2% 69 MMM BAX 14.00% 16.00% -6% BIG NFLX 13% 18% 21% 32.00% 45.00% 37.00% AKAM 10% 16.00% GE SPY 9% 11.00% 14% IWM EFA 9% EEM -1% 18.00% 15.00% 19.00% 1.00% 6.00% SHY IEF 1% 4% 13.50% TLT LQD 4% 7% 6.00% HYG 8% 8.00%
Step by Step Solution
There are 3 Steps involved in it

Get step-by-step solutions from verified subject matter experts