

Question: hey there, i would like an explanations for this please and thank you kindly Data es and Misuse of Total Marks: 25 marks Instructions: After
hey there, i would like an explanations for this please and thank you kindly
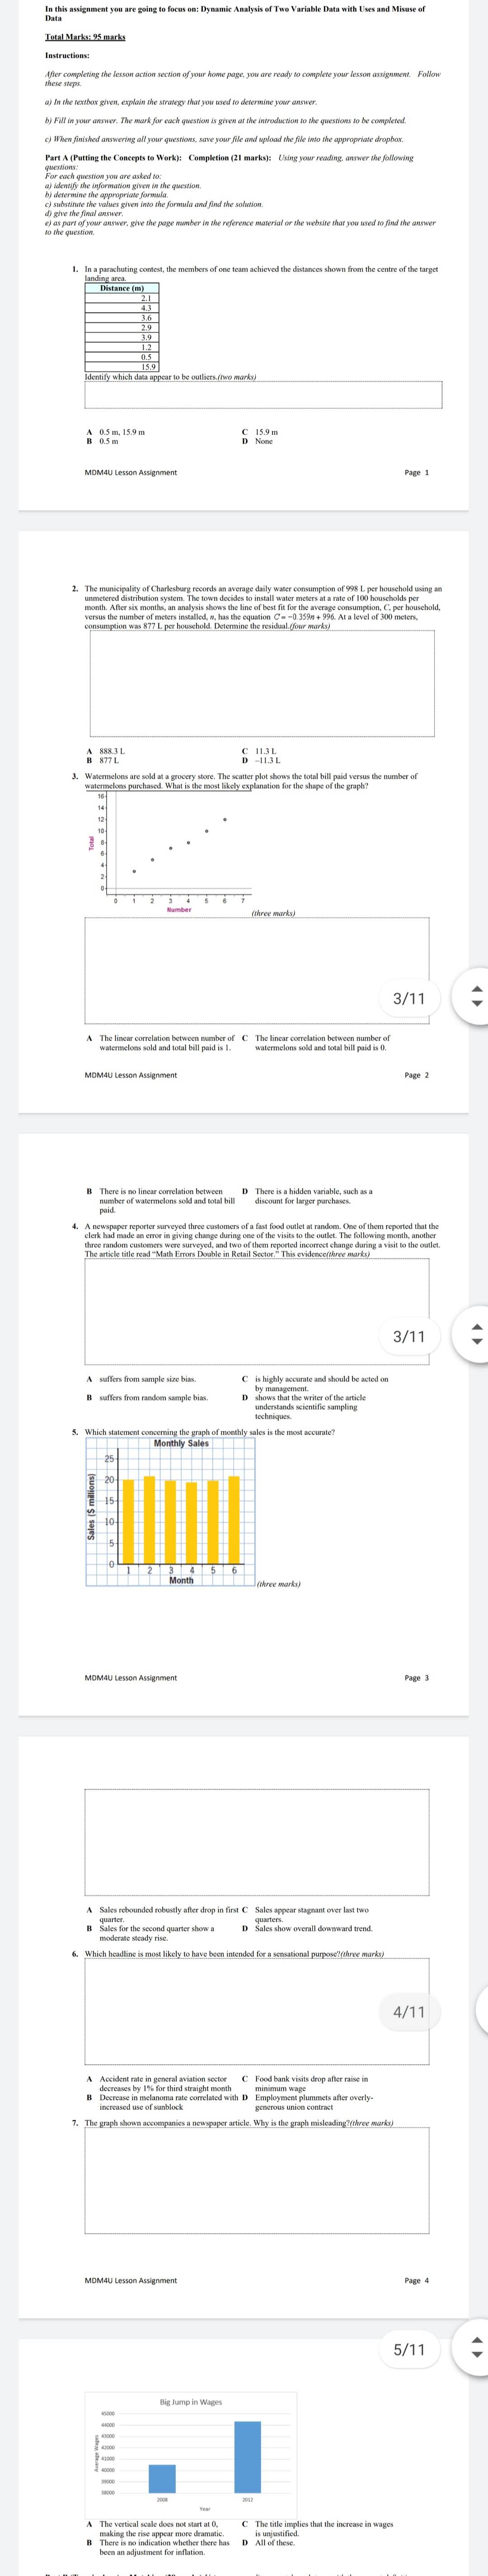
Data es and Misuse of Total Marks: 25 marks Instructions: After com ese steps. ") In the textbox given, explain questions to be completed. propriate dropbox. Part A (Putting the Concepts to Work): Completion (21 marks): Using your reading, answer the following For each question you are asked to: bl determine the appropriate formula. c) substitute the values given into the formula and find the solution ") as part of your answer, give the page number in the reference 1. In a parachuting contest, th entify which data appear to be outliers.(two marks) B 03 , 15.9 m MDM4U Lesson Assignment Page The municipality of Charlesburg records an average daily water consumption of 998 L per household using an month. After six months, an analysis shows the line of best fit for the average consumption, C. per household. consumption was 877 L per household. Determine the residual (four marks) 888.3 . Watermelons are sold " who is the most likely explanation for the shape and versus the number of (three marks ) 3/11 The linear correlation belly cen number near correlation between number of watermelons sold and total bill paid is 0. MDM4U Lesson Assignment Page 2 There is no linear correlation between number of watermelons sold and total bill discount for larger purchases. orter surveyed three customers of a fast food outlet at random. One of them reported that the three random customers were surveyed, and two of them reported incorrect change during a visit to the outlet. The article title read "Math Errors Double in Retail Sector." This evidence(three marks) 3/11 suffers from sample size bias. C is highly accurate and should be acted on B suffers from random sample bias. D shows that the writer finderstands scientific sampling 5. Which statement concerning the graph of monthly sales is the most accurate? Monthly Sales 25 5 8 Sales ($ millions) Month MOMAU Lesson Assignment Page 3 Sales rebounded robustly after drop in first C Sales appear stagnant over last two moderate he second quarter show a D Sales show overall downward trend. 6. Which headline is most likely to have been intended for a sensational purpose? (three marks) 4/11 Accident rate in general aviation sector C Food bank visits drop after raise in 3 Decrease in melanoma rate correlated with D Employment plummets af increased use of sunblock generous union contract . The graph shown accompanies a newspaper article. Why is the graph misleading?(three marks) MOM4U Lesson Assignment Page 4 5/11 Big Jump in Wages The vertical scale does not start at 0. C The title implies that the increase in wages been an adjustment for inflation
Step by Step Solution
There are 3 Steps involved in it

Get step-by-step solutions from verified subject matter experts