

Question: Hey would it be possible to explain the different steps to solve this problem? Thank you. Problem 2: The following table shows the average cost
Hey would it be possible to explain the different steps to solve this problem? Thank you.
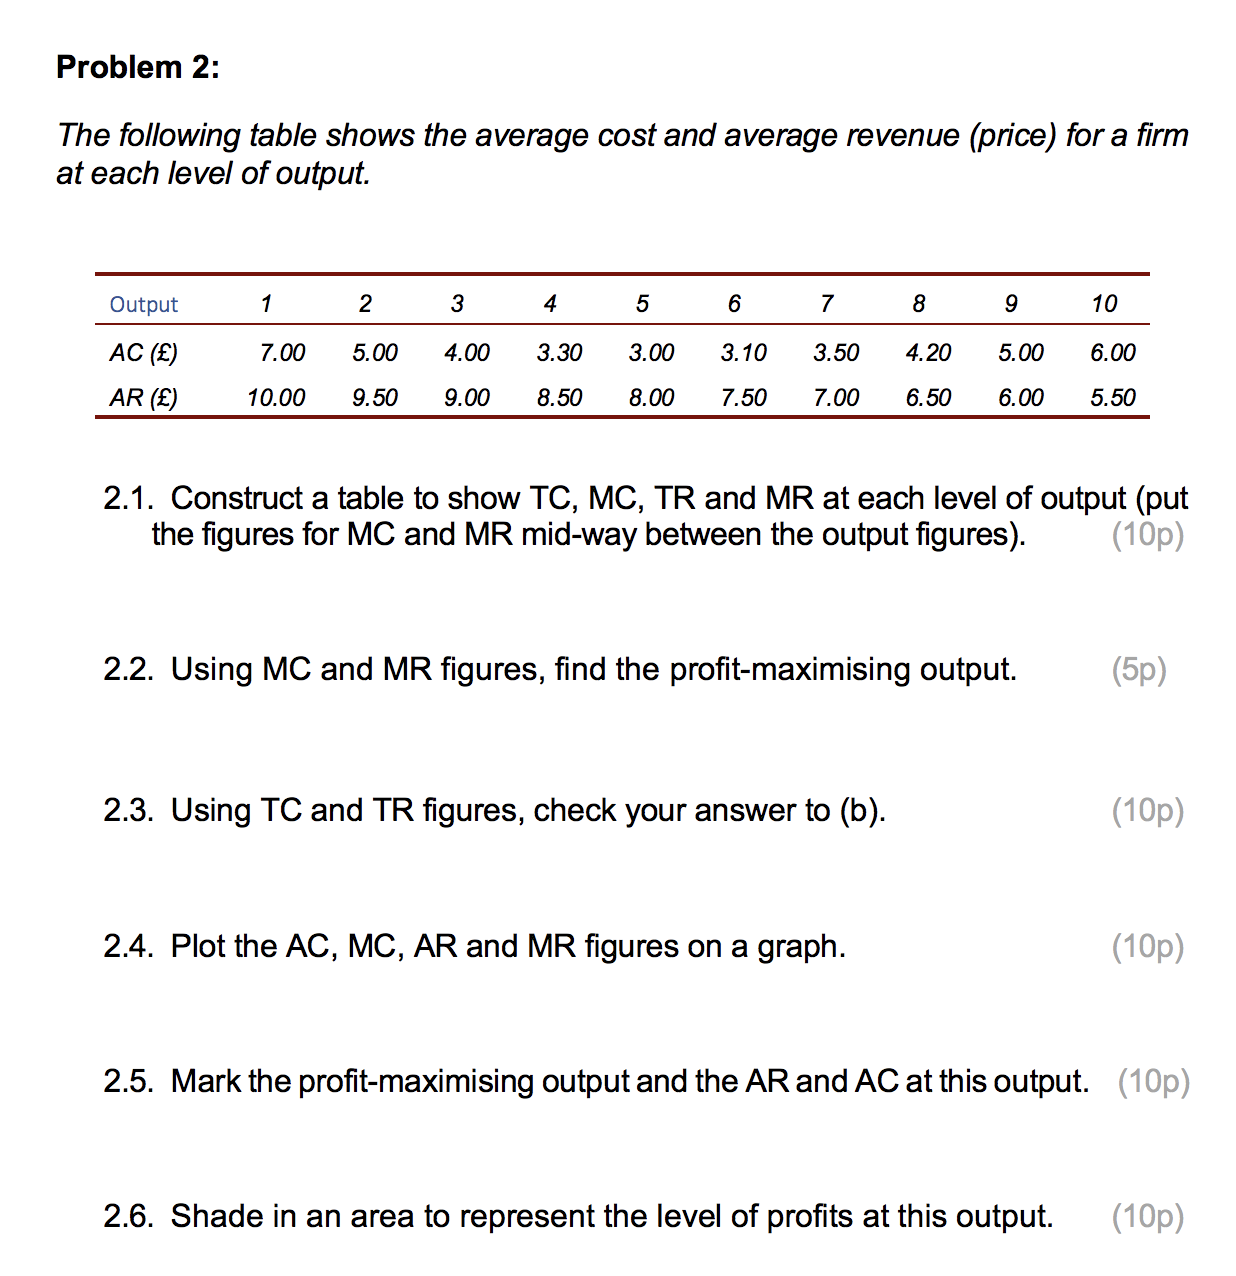
Problem 2: The following table shows the average cost and average revenue (price) for a firm at each level of output. Output 1 2 3 4 5 6 7 8 9 10 AC (E) 7.00 5.00 4.00 3.30 3.00 3.10 3.50 4.20 5.00 6.00 AR (f) 10.00 9.50 9.00 8.50 8.00 7.50 7.00 6.50 6.00 5.50 2.1. Construct a table to show TC, MC, TR and MR at each level of output (put the figures for MC and MR mid-way between the output figures). (10p) 2.2. Using MC and MR figures, find the profit-maximising output. (5p) 2.3. Using TC and TR figures, check your answer to (b). (10p) 2.4. Plot the AC, MC, AR and MR figures on a graph. (10p) 2.5. Mark the profit-maximising output and the AR and AC at this output. (10p) 2.6. Shade in an area to represent the level of profits at this output. (10p)
Step by Step Solution
There are 3 Steps involved in it

Get step-by-step solutions from verified subject matter experts