

Question: hhhhhhhhhhhhhhhhhhhhhhhhhhhhhhhhhhhhhelp Carl proceeds to make another graph, shown below. Residuals vs Fitted Values Plot for a Sample of 54 Perch by MB 300 200 Residuals
hhhhhhhhhhhhhhhhhhhhhhhhhhhhhhhhhhhhhelp
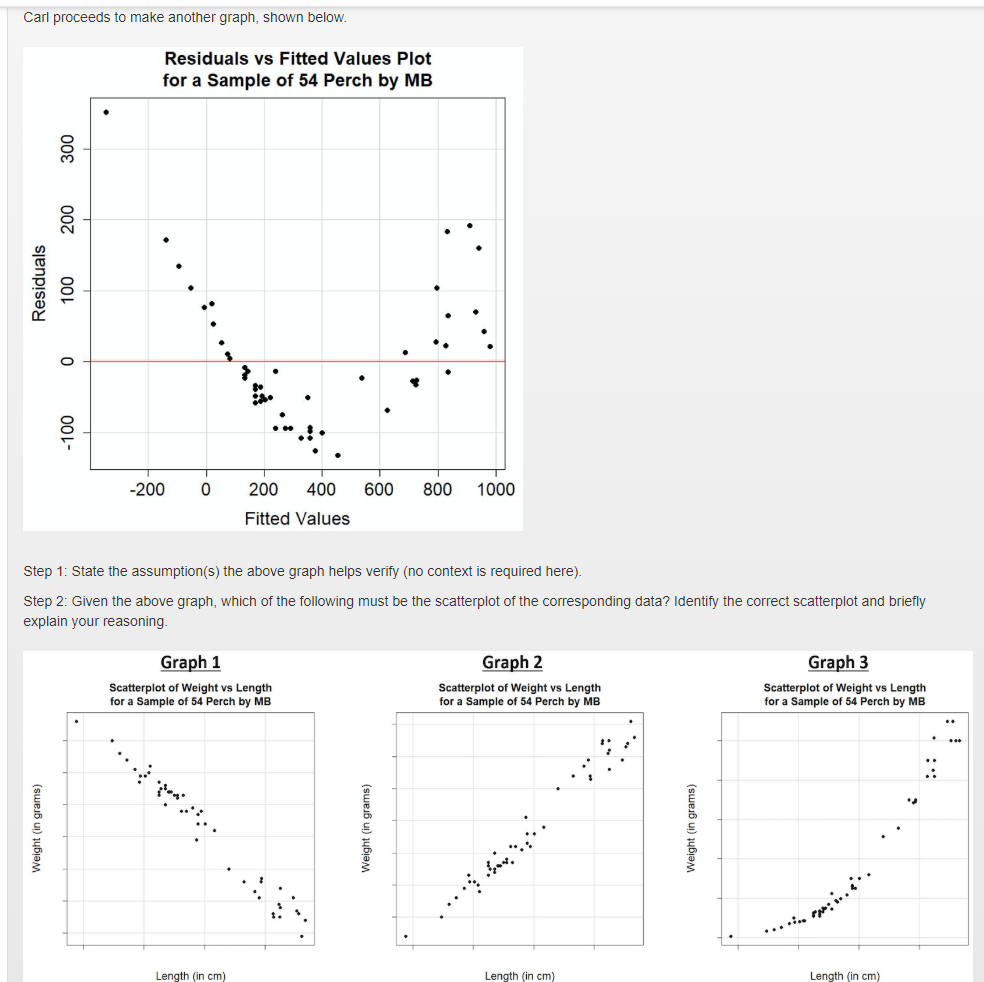
Carl proceeds to make another graph, shown below. Residuals vs Fitted Values Plot for a Sample of 54 Perch by MB 300 200 Residuals 100 O -100 -200 0 200 400 600 800 1000 Fitted Values Step 1: State the assumption(s) the above graph helps verify (no context is required here) Step 2: Given the above graph, which of the following must be the scatterplot of the corresponding data? Identify the correct scatterplot and briefly explain your reasoning Graph 1 Graph 2 Graph 3 Scatterplot of Weight vs Length for a Sample of 54 Perch by MB Scatterplot of Weight vs Length for a Sample of 54 Perch by MB Scatterplot of Weight vs Length for a Sample of 54 Perch by MB Weight (in grams) Weight (in grams) Weight (in grams)
Step by Step Solution
There are 3 Steps involved in it

Get step-by-step solutions from verified subject matter experts