

Question: Hi. Attached is one question (question 15) and the chart you must use to answer the question. Please let me know if I am missing
Hi. Attached is one question (question 15) and the chart you must use to answer the question. Please let me know if I am missing any information that would inhibit the ability of someone to help. Thanks!
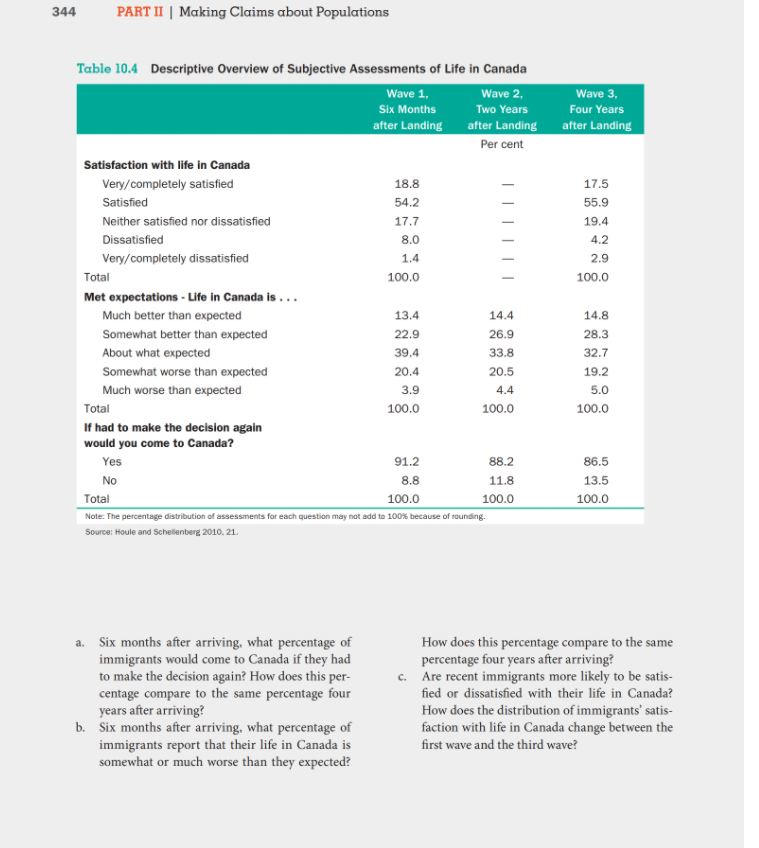
344 PART II | Making Claims about Populations Table 10.4 Descriptive Overview of Subjective Assessments of Life in Canada Wave 1, Wave 2 Wave 3, Six Months Two Years Four Years after Landing after Landing after Landing Per cent Satisfaction with life in Canada Very/completely satisfied 18.8 17.5 I Satisfied 54.2 65.9 Neither satisfied nor dissatisfied 17.7 19.4 Dissatisfied 8.0 4.2 Very/completely dissatisfied 1.4 2.9 Total 100.0 100.0 Met expectations - Life in Canada is . . . Much better than expected 13.4 14.4 14.8 Somewhat better than expected 22.9 26.9 28.3 About what expected 39.4 33.8 32.7 Somewhat worse than expected 20.4 20.5 19.2 Much worse than expected 3.9 4.4 5.0 Total 100.0 100.0 100.0 If had to make the decision again would you come to Canada? Yes 91.2 88.2 86.5 NO 8.8 11.8 13.5 Total 100.0 100.0 100.0 Note: The percentage distribution of assessments for each question may not add to 100% because of rounding. Source: Houle and Schellenberg 2010, 21. Six months after arriving, what percentage of How does this percentage compare to the same immigrants would come to Canada if they had percentage four years after arriving? to make the decision again? How does this per- C. Are recent immigrants more likely to be satis- centage compare to the same percentage four fied or dissatisfied with their life in Canada? years after arriving? How does the distribution of immigrants' satis- b. Six months after arriving, what percentage of faction with life in Canada change between the immigrants report that their life in Canada is first wave and the third wave? somewhat or much worse than they expected?15. Canada's Longitudinal Survey of Immigrants to Canada (isic) collected information from a random sample of immigrants to Canada. Each person was interviewed three times: once six months after arriving in Canada, then two years after arriv- ing in Canada, and, finally, four years after arriving in Canada. Table 10.4 is excerpted from a Statistics Canada report investigating immigrants' assessment of their life in Canada
Step by Step Solution
There are 3 Steps involved in it

Get step-by-step solutions from verified subject matter experts