

Question: please help me with these two questions, will be really appreciated. Question 1 (Note: round your answers to 3 decimals) This question studies the gender
please help me with these two questions, will be really appreciated.
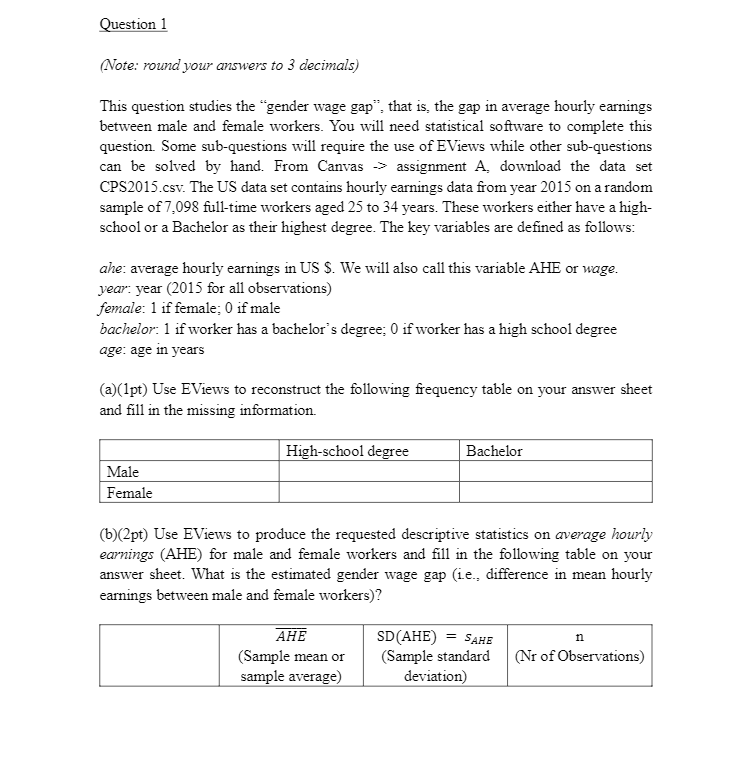
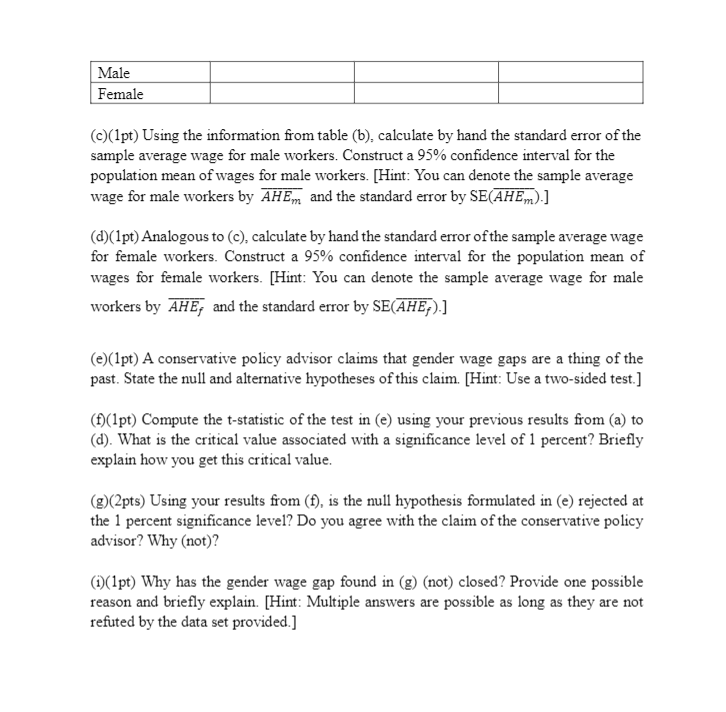
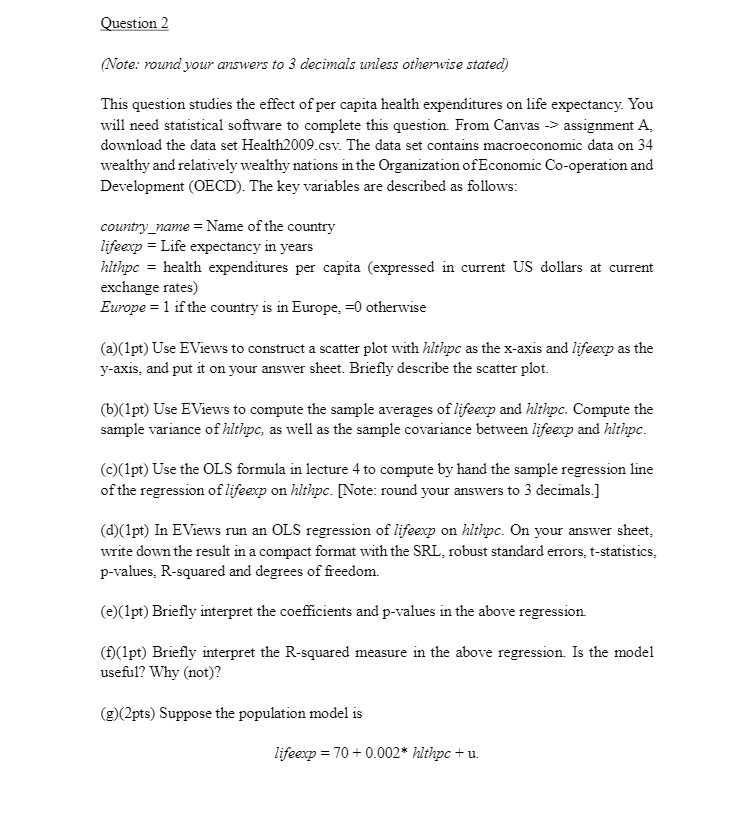
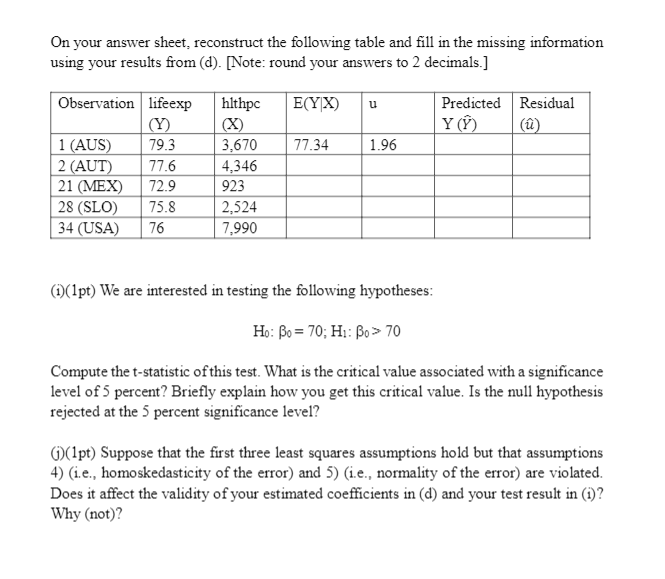
Question 1 (Note: round your answers to 3 decimals) This question studies the "gender wage gap": that is, the gap in average hourly earnings between male and female workers. You will need statistical software to complete this question. Some sub-questions will require the use of EViews while other sub-questions can be solved by hand. From Canvas -> assignment A, download the data set CPS2015.csv. The US data set contains hourly earnings data from year 2015 on a random sample of 7,098 full-time workers aged 25 to 34 years. These workers either have a high- school or a Bachelor as their highest degree. The key variables are defined as follows: ahe: average hourly earnings in US $. We will also call this variable AHE or wage. year: year (2015 for all observations) female: 1 if female; 0 if male bachelor: 1 if worker has a bachelor's degree; 0 if worker has a high school degree age: age in years (a)(1pt) Use EViews to reconstruct the following frequency table on your answer sheet and fill in the missing information. High-school degree Bachelor Male Female (b)(2pt) Use EViews to produce the requested descriptive statistics on average hourly earnings (AHE) for male and female workers and fill in the following table on your answer sheet. What is the estimated gender wage gap (ie., difference in mean hourly earnings between male and female workers)? AHE SD(AHE) = SAHE n (Sample mean or (Sample standard (Nr of Observations) sample average) deviation)Male Female (c)(1pt) Using the information from table (b), calculate by hand the standard error of the sample average wage for male workers. Construct a 95% confidence interval for the population mean of wages for male workers. [Hint: You can denote the sample average wage for male workers by AHEm and the standard error by SE(AHEm).] (d)(1pt) Analogous to (c), calculate by hand the standard error of the sample average wage for female workers. Construct a 95% confidence interval for the population mean of wages for female workers. [Hint: You can denote the sample average wage for male workers by AHE, and the standard error by SE(AHE,).] (e)(1pt) A conservative policy advisor claims that gender wage gaps are a thing of the past. State the null and alternative hypotheses of this claim. [Hint: Use a two-sided test.] (f)(1pt) Compute the t-statistic of the test in (e) using your previous results from (a) to (d). What is the critical value associated with a significance level of 1 percent? Briefly explain how you get this critical value. (g)(2pts) Using your results from (f), is the null hypothesis formulated in (e) rejected at the 1 percent significance level? Do you agree with the claim of the conservative policy advisor? Why (not)? (i)(1pt) Why has the gender wage gap found in (g) (not) closed? Provide one possible reason and briefly explain. [Hint: Multiple answers are possible as long as they are not refuted by the data set provided.]Question 2 (Note: round your answers to 3 decimals unless otherwise stated) This question studies the effect of per capita health expenditures on life expectancy. You will need statistical software to complete this question. From Canvas -> assignment A. download the data set Health2009.csv. The data set contains macroeconomic data on 34 wealthy and relatively wealthy nations in the Organization of Economic Co-operation and Development (OECD). The key variables are described as follows: country_name = Name of the country lifeexp = Life expectancy in years hithpc = health expenditures per capita (expressed in current US dollars at current exchange rates) Europe = 1 if the country is in Europe, =0 otherwise (a)(1pt) Use EViews to construct a scatter plot with hithpc as the x-axis and lifeexp as the y-axis, and put it on your answer sheet. Briefly describe the scatter plot. (b)(1pt) Use EViews to compute the sample averages of lifeexp and hithpc. Compute the sample variance of hithpc, as well as the sample covariance between lifeexp and hithpc. (c)(1pt) Use the OLS formula in lecture 4 to compute by hand the sample regression line of the regression of lifeexp on hithpc. [Note: round your answers to 3 decimals.] (d)(1pt) In EViews run an OLS regression of lifeexp on hithpc. On your answer sheet, write down the result in a compact format with the SRL, robust standard errors, t-statistics, p-values, R-squared and degrees of freedom. (e)(1pt) Briefly interpret the coefficients and p-values in the above regression. (f)(1pt) Briefly interpret the R-squared measure in the above regression. Is the model useful? Why (not)? (@)(2pts) Suppose the population model is lifeexp = 70 + 0.002* hithpc + u.On your answer sheet, reconstruct the following table and fill in the missing information using your results from (d). [Note: round your answers to 2 decimals.] Observation lifeexp hithpc E(Y X) u Predicted Residual (Y) (X) Y (P 1 (AUS) 79.3 3,670 77.34 1.96 2 (AUT) 77.6 4,346 21 (MEX) 72.9 923 28 (SLO) 75.8 2,524 34 (USA) 76 7,990 (i)(1pt) We are interested in testing the following hypotheses: Ho: Bo = 70; HI: Bo > 70 Compute the t-statistic of this test. What is the critical value associated with a significance level of 5 percent? Briefly explain how you get this critical value. Is the null hypothesis rejected at the 5 percent significance level? ((1pt) Suppose that the first three least squares assumptions hold but that assumptions 4) (i.e., homoskedasticity of the error) and 5) (i.e., normality of the error) are violated. Does it affect the validity of your estimated coefficients in (d) and your test result in (i)? Why (not)
Step by Step Solution
There are 3 Steps involved in it

Get step-by-step solutions from verified subject matter experts