

Question: Hi, base on this case can you answer this following question? - Identification issues and prioritisation of key strategic issues - Application of concepts, theory
Hi, base on this case can you answer this following question?
- Identification issues and prioritisation of key strategic issues
- Application of concepts, theory and tools
- Critical analysis and evaluation
- Recommendations and justifications
The attachment below is case study:
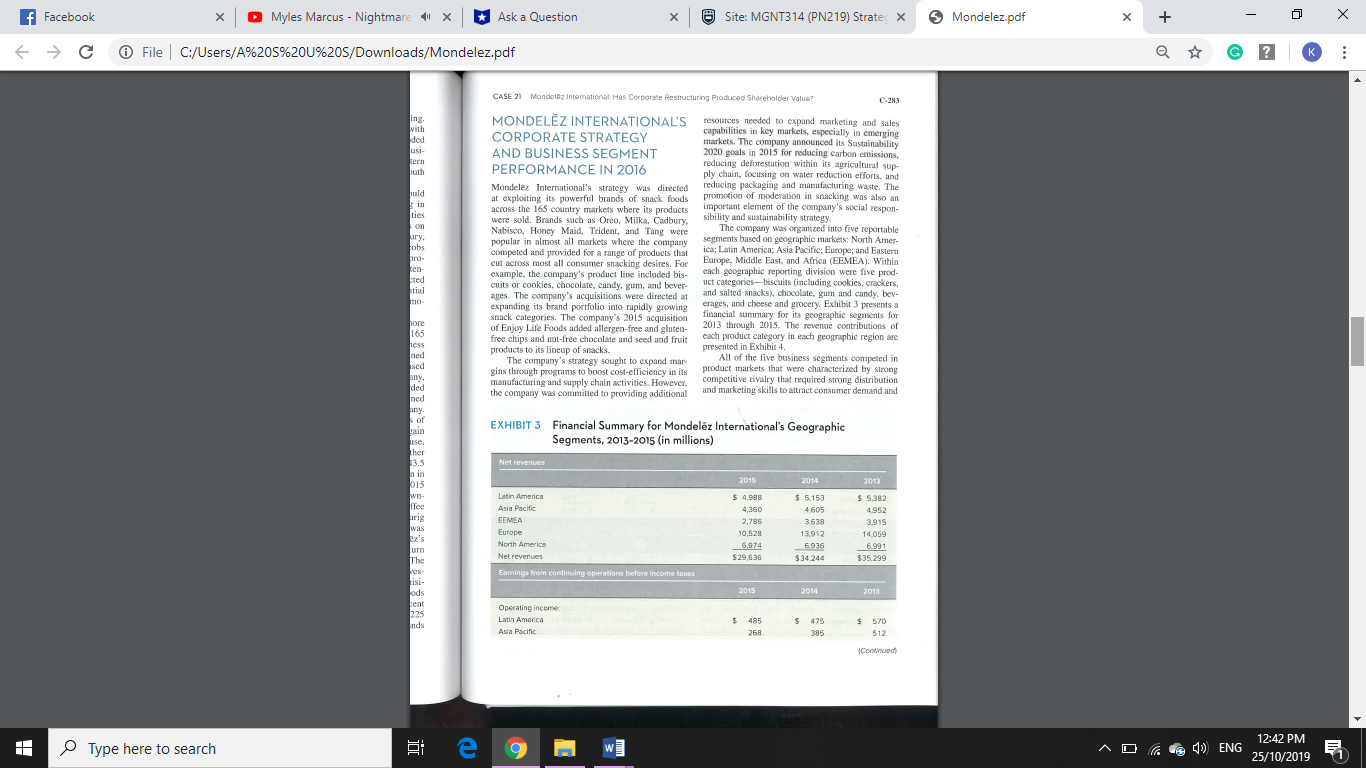
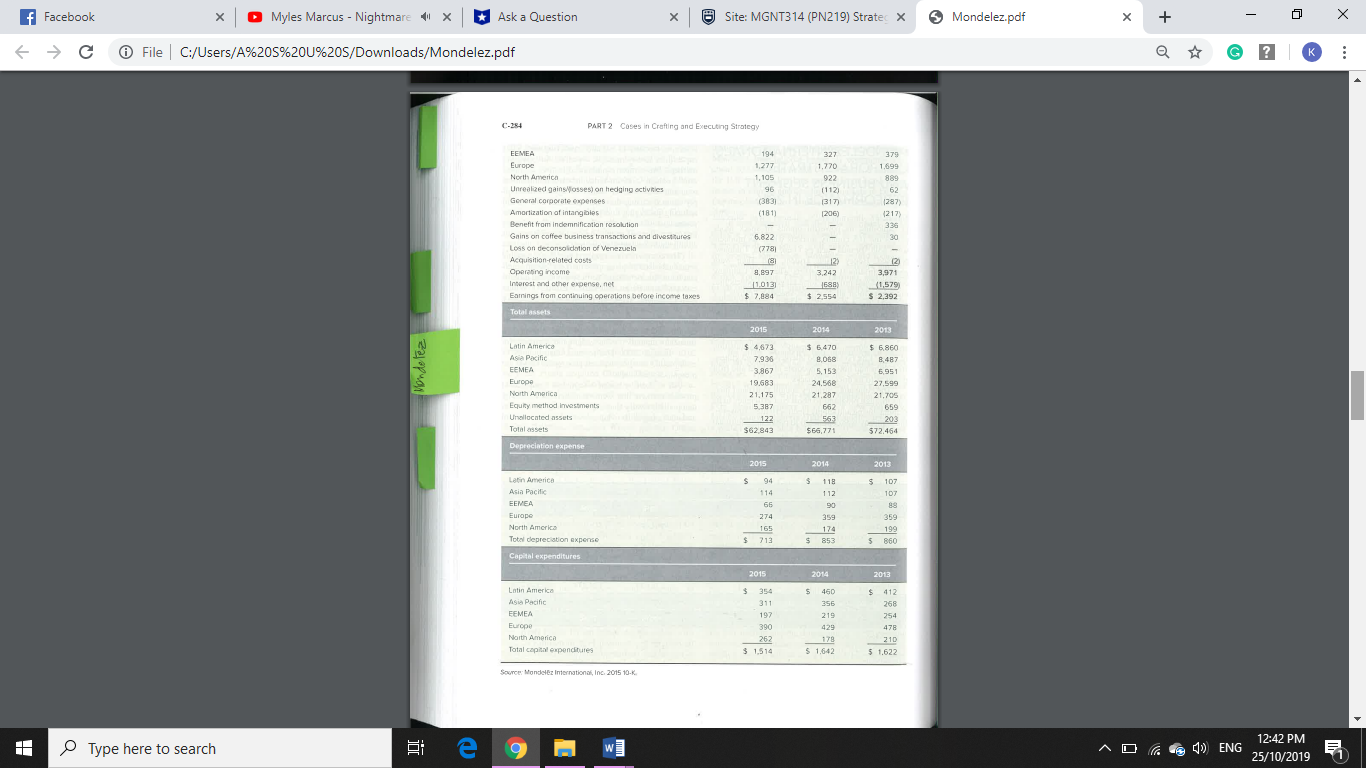
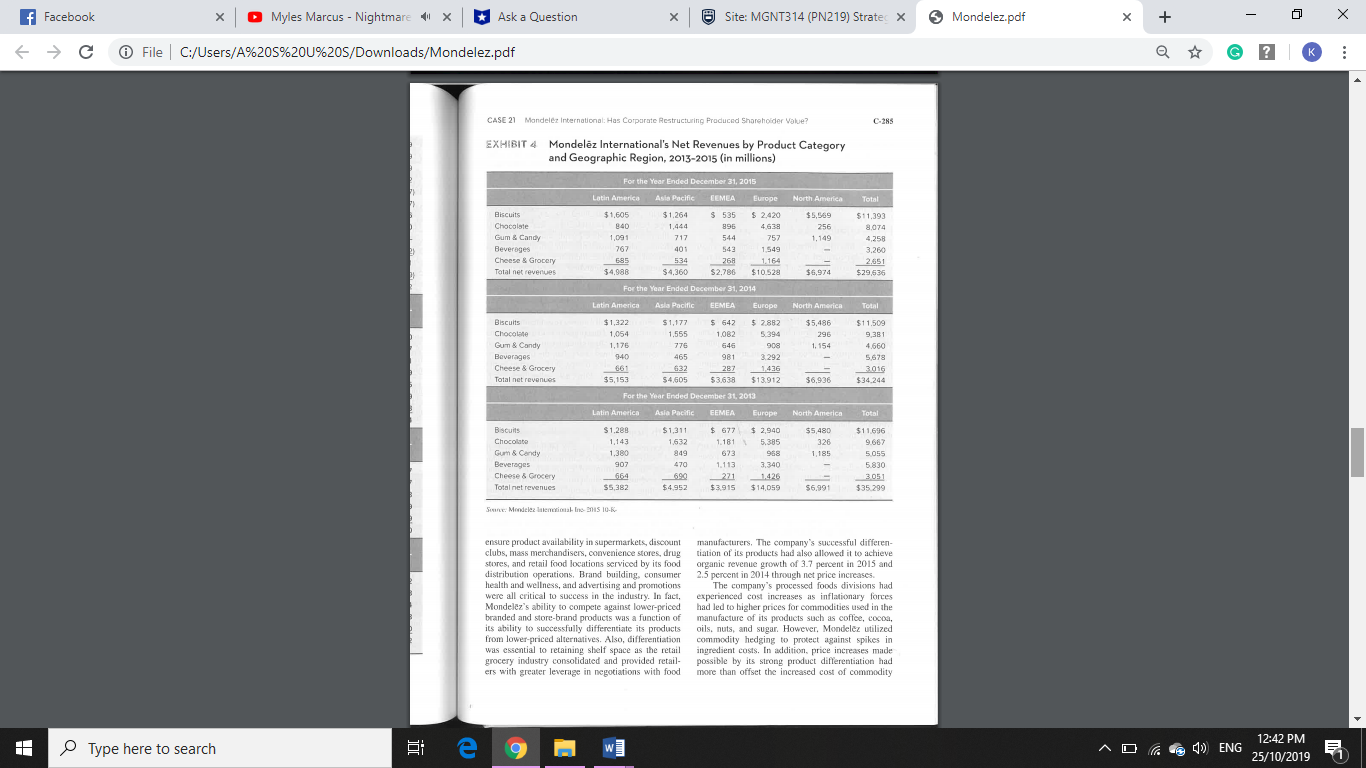
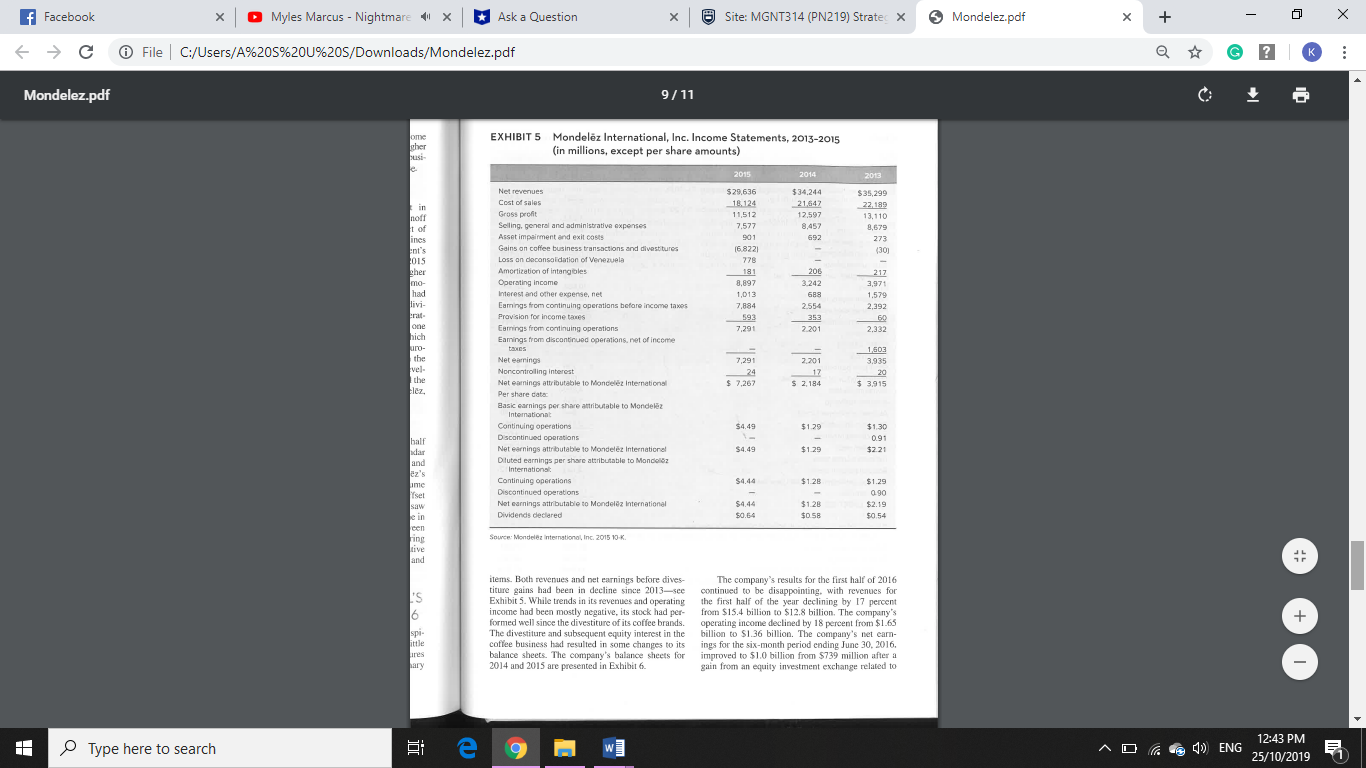
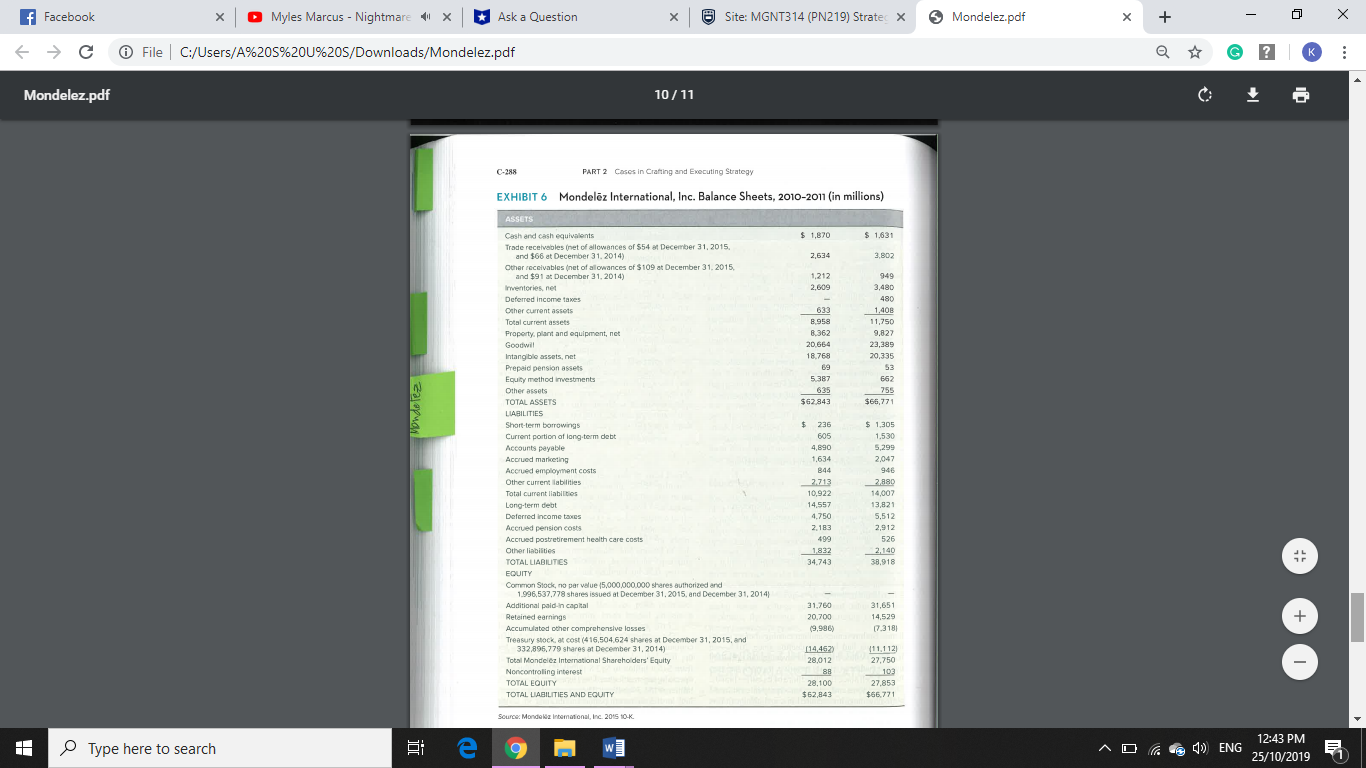
f Facebook X Myles Marcus - Nightmare 1 X Ask a Question X Site: MGNT314 (PN219) Strateg X 5 Mondelez.pdf X X C @ File | C:/Users/A%205%20U%205/Downloads/Mondelez.pdf G ? K Mondelez.pdf 11 / 11 CASE 21 Mordelez International: Has Corporate Restructuring Produced Shareholder Value? C-289 its exchange of ownership in the JDE coffee invest- ment for a 24.2 percent ownership in Keurig. market with significant growth potential, and our Mondelez International's chair and CEO Irene substantial investment in e-commerce." Activist Rosenfeld saw positive signs in the results of the investor William Ackman, who was the company's third-largest shareholder with a 5.6 percent stake 31 first six months of 2016. "Despite a challenging 302 macro environment, our strong execution and first- in the company. continued to suggest in mid-2016 half performance give us confidence in delivering that the company must lower costs and improve 349 our 2016 outlook and 2018 margin targets, Our sales significantly or find a buyer for the company. ongoing focus on operational efficiency enables us Going into the last half of 2016. Mondelez man- to invest for sustainable, profitable growth in our agement was confident in its corporate strategy and Power Brands. white-space expansion and sales projected that the company would achieve 2 percent organic revenue growth and a 13-16 percent oper- 750 capabilities. This is evidenced by our upcoming 327 launch of Milka chocolate in China, a $2.8 billion ating income margin to deliver double-digit growth in EPS by year-end. 989 335 53 562 ENDNOTE 'as quoted in "Mondelez International Reports 02 Birsalts," Globe Newswhe. July 27. 2016 305 299 047 180 321 512 312 526 140 + 651 529 3181 1 121 750 103 353 371 Type here to search e on A DENG 12:43 PM 25/10/2019f Facebook X Myles Marcus - Nightmare 1 X Ask a Question X Site: MGNT314 (PN219) Strateg X 5 Mondelez.pdf X X C @ File | C:/Users/A%205%200%205/Downloads/Mondelez.pdf G ? K CASE 21 Mondeliz International Has Corporate Restructuring Produced Shareholder Value? C-283 ing. with MONDELEZ INTERNATIONAL'S resources needed to expand marketing and sales ded CORPORATE STRATEGY capabilities in key markets, especially in emerging usi- cern AND BUSINESS SEGMENT markets. The company announced its Sustainability 2020 goals in 2015 for reducing carbon emissions, uth PERFORMANCE IN 2016 reducing deforestation within its agricultural sup- ply chain, focusing on water reduction efforts. and Mondelez International's strategy was directed reducing packaging and manufacturing waste. The in at exploiting its powerful brands of snack foods promotion of moderation in snacking was also an ties across the 165 country markets where its products important element of the company's social respon sibility and sustainability strategy. on were sold. Brands such as Oreo, Milka, Cadbury. The company was organized into five reportable ary, Nabisco, Honey Maid, Trident, and Tang were cobs popular in almost all markets where the company segments based on geographic markets: North Amer- pro- competed and provided for a range of products that ica; Latin America; Asia Pacific; Europe; and Eastern Europe, Middle East, and Africa (EEMEA). Within ten- cut across most all consumer snacking desires. For sted example. the company's product line included bis- each geographic reporting division were five prod- ntial cuits or cookies, chocolate, candy, gum, and bever- act categories-biscuits (including cookies, crackers, ages. The company's acquisitions were directed at and salted snacks), chocolate, gum and candy, bev- expanding its brand portfolio into rapidly growing erages, and cheese and grocery. Exhibit 3 presents a ore snack categories. The company's 2015 acquisition financial summary for its geographic segments for 165 of Enjoy Life Foods added allergen-free and gluten- 2013 through 2015. The revenue contributions of ness free chips and nut-free chocolate and seed and fruit each product category in each geographic region are ned products to its lineup of snacks. presented in Exhibit 4. sed The company's strategy sought to expand mar- All of the five business segments competed in any, gins through programs to boost cost-efficiency in its product markets that were characterized by strong ded manufacturing and supply chain activities. However. competitive rivalry that required strong distribution ned he company was committed to providing additional and marketing skills to attract consumer demand and any. of Lain EXHIBIT 3 Financial Summary for Mondelez International's Geographic use. Segments, 2013-2015 (in millions) ther 13 5 Net revenues n in 015 2015 2014 2013 wn- Latin America $ 4,988 5.153 5,382 free Asia Pacific 4,360 1.605 4.952 aris EEMEA 2,786 3.638 3.915 was Europe 10,528 13.912 14.059 turn North America 6.974 6936 6.991 The Net revenues $29,636 $34.244 $35,299 res- nisi- Earnings from continuing come taxes ods 2015 2014 2013 ent 225 Operating income Inds Latin America $ 485 $ 475 $ 570 Asia Pacific 235 512 (Continued) Type here to search e WE A DENG 12:42 PM 25/10/2019f Facebook X Myles Marcus - Nightmare 1 X Ask a Question X Site: MGNT314 (PN219) Strateg X 5 Mondelez.pdf X X C @ File | C:/Users/A%205%20U%205/Downloads/Mondelez.pdf G ? K C-284 PART 2 Cases in Crafting and Executing Strategy EEMEA 194 327 379 Europe 1,277 1,770 1.699 North America 1,105 922 889 Unrealized gainsVosses) on hedging activities 96 (112) 62 General corporate expenses (383) (317) (287) Amortization of intangibles (181) [206) (217) enefit from indemnification resolution 336 Gains on coffee business transactions and divestitures 6.822 30 Loss on deconsolidation of Venezuela (778) Acquisition-related costs 123 Operating income 8,897 3.242 3,971 Interest and other expense. net (1.013) (1,579) Earnings from continuing operations before income taxes $ 7.284 $ 2,554 2.392 Total assets 2015 2014 2013 Monde lez Latin America $ 4,673 $ 6.470 6.860 Asia Pacific 7.930 8,068 8.487 EEMEA 3.867 5,153 5,951 Europe 19.683 24.568 27.59 North America 21.175 21,287 21.70 Equity method Investments 5 387 642 Unallocated assets 122 203 Total assets $62,843 566,771 $72.464 Depreciation expense 2015 2014 2013 Latin America 94 118 107 Asia Pacific 114 1 12 107 EEMEA 66 90 83 Europ 274 359 359 North America 165 174 199 Total depreciation expense $ 713 $ 853 5 860 Capital expenditures 2015 2014 2013 Latin America 354 $ 460 $ 412 Asia Pacific 311 356 268 EEMEA 197 219 754 Europe 390 129 478 North America 262 210 Total capital expenditures 3 1.514 $ 1,642 $ 1.622 Source: Mondelez International, Inc. 2015 10-K. Type here to search e 9 WE A DENG 12:42 PM 25/10/2019f Facebook Myles Marcus - Nightmare 1 X Ask a Question X Site: MGNT314 (PN219) Strateg X 5 Mondelez.pdf X X X C @ File | C:/Users/A%205%200%205/Downloads/Mondelez.pdf G ? K CASE 21 Mandelez International: Has Corporate Restructuring Produced Shareholder Value? C-285 EXHIBIT 4 Mondelez International's Net Revenues by Product Category and Geographic Region, 2013-2015 (in millions) For the Year er 31, 2015 Latin America Asia Pacific EEMEA Europe North America Total Biscuits :1.605 $1.264 $ 535 $ 2.420 $5,569 $11.393 Chocolate 1,444 896 4638 756 8.074 Gum & Candy 1,091 717 544 757 1,149 4,258 Beverages 767 401 543 1.549 3.260 Cheese & Grocery 685 534 768 1.164 2.651 Total net revenues 4.988 $4.360 $2.786 $10.528 $6,974 $29,535 For the Year 31, 2014 Latin America EMEA Europe North Amo Total Biscuits $1,322 $1,177 $ 642 $ 2.882 $5.486 1 1.509 Chocolate 1.054 1.555 1.082 5.394 296 9,381 Gun & Candy 1,176 776 645 908 . 154 4.660 Beverages 465 981 3292 5.678 Cheese & Grocery 661 632 287 1,436 3016 Total net revenues $5,15 $4,605 $3.638 $13.912 36,936 $34.244 For the Y 31. 2013 Latin America EEMEA Europe North Ame Total Blacuits $ 1.288 $1,311 $ 677 $ 2,940 $5,480 $ 1 1.696 Chocolate 1.143 1.632 1.181 5.3:85 326 9.687 Gurn & Candy 1,380 849 673 968 185 5.055 Beverages 907 470 1,113 3.340 5.830 Cheese & Grocery 664 690 271 1.426 3 051 Total net revenues $5,382 $4.952 $3.915 $14.059 $6.991 $35.299 Sonne. Mondelez Intentional- Inc- 2715 10-K ensure product availability in supermarkets, discount manufacturers, The company's successful differen- clubs, mass merchandisers, convenience stores, drug tiation of its products had also allowed it to achieve stores, and retail food locations serviced by its food organic revenue growth of 3.7 percent in 2015 and distribution operations, Brand building, consumer 2.5 percent in 201+ through net price increases. health and wellness, and advertising and promotions The company's processed foods divisions had were all critical to success in the industry. In fact, experienced cost increases as inflationary forces Mondelez's ability to compete against lower-priced had led to higher prices for commodities used in the branded and store-brand products was a function of manufacture of its products such as coffee, cooca, its ability to successfully differentiate its products oils. nuts, and sugar. However, Mondelez utilized from lower-priced alternatives. Also, differentiation commodity hedging to protect against spikes in was essential to retaining shelf space as the retail ingredient costs. In addition, price increases made grocery industry consolidated and provided retail- possible by its strong product differentiation had ers with greater leverage in negotiations with food more than offset the increased cost of commodity 12:42 PM Type here to search e WE A DENG 25/10/2019f Facebook X Myles Marcus - Nightmare 1 X Ask a Question X Site: MGNT314 (PN219) Strateg X 5 Mondelez.pdf X X C @ File | C:/Users/A%205%20U%205/Downloads/Mondelez.pdf G ? K Mondelez.pdf 8/ 11 C-286 PART 2 Cases in Crafting and Executing Strategy inputs in 2015. Also, the production of Mondelez International's products was regulated by the U.S. and Africa segment. The division's operating income declined by 40.7 percent in 2015 because of higher Food and Drug Administration in the United States, commodity costs, the deconsolidation of its coffee busi- and similar organizations in the 165 countries where ness, and higher advertising and promotion expense. its products were sold. The company's packaging practices were also regulated by governmental agen- cies in the United States and the European Union. Europe Segment revenues declined by 24.3 percent in Latin America Europe between 2014 and 2015 after the spinoff In 2015, Modelez International's Latin American of the company's coffee brands and the effect of division experienced a 3.2 percent decline in rev- exchange rate adjustments and volume declines enuc, primarily because of unfavorable exchange associated with price increases, The segment's rates and declining sales. The strong U.S. dollar operating income declined by 27.9 percent in 2015 relative to the Brazilian real, Mexican peso, Venezu- because of coffee deconsolidation costs, higher elan bolivar, and Argentinean peso accounted for the ingredient costs, and higher advertising and promo- majority of exchange rate losses. The sales decline tion expense. Earlier in the decade, the segment had was brought about by the elimination of selected been among the company's most successful divi- low-margin products from its product mix and con- sions, with traditionally strong revenue and operat- sumer resistance to price increases. The spinoff ing income growth. The company held a number one of the company's coffee brands also affected sales position in the snack foods industry in Europe, which in Latin America in 2015. Mondelez's operating was growing 1.4 times faster than the overall Euro- income increased by 2.1 percent in 2015 as a result pean processed foods industry. While growth in the of price increases and lower operating costs. snack foods industry in Europe was attractive, devel- oping markets in Latin America and Asia offered the Asia Pacific most attractive growth opportunities for Mondelez, Nestle, and other food companies in 2016. Mondelez International's revenues in Asia Pacific declined by $245 million during 2015-primarily North America for the same reasons that caused the decline in net revenues in Latin America. Exchange rate losses Net revenues increased by $38 million or one-half related to the value of the U.S. dollar relative to the of 1 percent because of an accounting calendar Australian dollar, Indian rupee, and Japanese yen; change, the acquisition of Enjoy Life Foods, and consumer resistance to price increases; the elimi- added revenues from slight price cuts on Mondelez's nation of low-margin products; and spinoff of oof- best-selling cookie and candy brands. The volume fee brands all contributed to the decline, Operating increases in biscuits and candy were partially offset income for the segment declined by 30.4 percent by volume declines in gum and chocolate which saw between 2014 and 2015 because of restructuring price increases during the year. Operating income in costs, higher ingredient costs, and higher advertising North America increased by 19.8 percent between and promotion expense. However, price increases 2014 and 2015 because of lower manufacturing and lower manufacturing costs helped prevent a costs; lower selling, general and administrative larger operating loss in the region during 2015. expenses; the absence of restructuring costs; and lower commodity prices. Eastern Europe, Middle MONDELEZ INTERNATIONAL'S + East, and Africa The mix of exchange rate losses, the negative impact PERFORMANCE IN LATE 2016 of price increases on consumer demand, and the elimi- Mondelez International's results since its spi- nation of the coffee business contributed to a 23.4 percent decline in net revenues between 2014 and noff from Kraft Foods had been mixed with little 2015 for the company's Eastern Europe, Middle East, sustained growth in revenues or profit measures excluding the effects of one-time extraordinary Type here to search e 9 WE A DENG 12:42 PM 25/10/2019f Facebook X Myles Marcus - Nightmare 1 X Ask a Question X Site: MGNT314 (PN219) Strateg X 5 Mondelez.pdf X X C @ File | C:/Users/A%205%20U%205/Downloads/Mondelez.pdf G ? K Mondelez.pdf 9 / 11 Jome her EXHIBIT 5 Mondelez International, Inc. Income Statements, 2013-2015 usi- (in millions, except per share amounts) 2015 2014 2013 Net revenues $29.636 $34.244 $35,299 Cost of sales 18.124 21.647 27,182 noff Gross profit 11,512 2.597 13.110 t of Selling, general and administrative expenses 7.577 8,457 8,679 ines Asset impairment and exit costs 901 697 273 :nt's Gains on coffee business transactions and divestitures (6.822) (30] Loss on doconsolidation of Venezuela 778 pher Amortization of intangibles 181 206 217 mo- Operating income 8,897 3 242 3,971 had Interest and other expense. net 1,013 688 1.579 livi- Earnings from continuing operations before income taxes 7.884 2.554 2,392 rat- Provision for income taxes 593 353 60 one hich Earnings from continuing operations 7,291 2.201 2.332 um- Eamings from discontinued operations. net of income 1,603 the Net earrings 7,291 2,201 3.935 yel- 20 the Noncontrolling interest 24 Net earnings attributable to Mondelez International $ 7,267 $ 2, 184 $ 3,915 Per share data Basic earnings per share attributable to Mondelaz International Continuing operations $4.49 $1.29 $1.30 half Discontinued operations 0.91 alar Net earnings attributable to Mondelez International $4.49 $1.29 $2.21 and Diluted earnings per share attributable to Mondo 5z ez's International: me Continuing operations $4.44 $1.28 $1.29 Yset Discontinued operations 090 saw Net earnings attributable to Mondeliz International $4.44 $1.28 $2.19 be in Dividends declared 50.64 $0.54 been ring Source: Mondelez International Inc. 2015 10-K. live and items. Both revenues and net earnings before dives- The company's results for the first half of 2016 ticure gains had been in decline since 2013-see Exhibit 5. While trends in its revenues and operating continued to be disappointing, with revenues for income had been mostly negative, its stock had per- the first half of the year declining by 17 percent 16 from $15.4 billion to $12.8 billion. The company's formed well since the divestiture of its coffee brands. operating income declined by 18 percent from $1.65 + spi- ittle The divestiture and subsequent equity interest in the billion to $1.36 billion. The company's net carn- ures coffee business had resulted in some changes to its balance sheets. The company's balance sheets for ings for the six-month period ending June 30. 2016. hary 2014 and 2015 are presented in Exhibit 6. improved to $1.0 billion from $739 million after a gain from an equity investment exchange related to Type here to search e WE A DENG 12:43 PM 25/10/2019f Facebook X Myles Marcus - Nightmare 1 X Ask a Question X Site: MGNT314 (PN219) Strateg X 5 Mondelez.pdf X X C @ File | C:/Users/A%205%20U%205/Downloads/Mondelez.pdf G ? K Mondelez.pdf 10 / 11 C-288 PART 2 Cases in Crafting and Executing Strategy EXHIBIT 6 Mondelez International, Inc. Balance Sheets, 2010-2011 (in millions) ASSETS Cash and cash equivalents $ 1,870 $ 1,631 Trade receivables (net of allowances of $54 81 December 31, 2015. and $66 at December 31. 2014) 2,634 3.802 Other receivables (net of allowances of $109 at December 31. 2015, and $91 at December 31, 2014) 1,212 749 Inventories. net 2.609 1,480 Deferred income taxes 480 Other current assets 633 1.408 Total current assets 8.958 11,750 Property, plant and equipment, net 8.362 9.827 Goodwill 20.664 23,389 Intangible assets, net 18.768 70.335 Prepaid pension assets Equity method Investments 5 387 562 Monde lez Other assets 635 755 TOTAL ASSETS 62.843 $65,771 LIABILITIES Short-term borrowings 236 SOE'L $ Current portion of long-term debt 605 1.530 Accounts payable 4,890 5,299 Accrued marketing 1.634 2.047 Accrued employment costs 844 946 Other current abilities 3.713 Total current liabilities 10,922 14,007 Long-term debt 14.557 13,821 Deferred income taxes 4.750 5,512 Accrued pension costs 2. 1 83 2,912 Accrued postretirement health care costs 499 526 Other liabilities 1.832 2,140 TOTAL LIABILITIES 34.743 38.918 EQUITY Common Stock, no par value (5,000,000.090 shares authorized and 1.996,537,778 shares issued at December 31, 2015, and December 31, 2014) Additional paid-in capital 31,760 31,651 Retained earnings 70.700 14.529 + Accumulated other comprehensive losses 9.9813 (7.318) Treasury stock. at cost (416.504.624 shares at December 31, 2015, and 332,895,779 shares at December 31, 2014) (14,467) 11,1 12) Total Mondelez International Shareholders' Equity 28.012 27,750 Noncontrolling interest 88 103 TOTAL EQUITY 28.100 27.853 TOTAL LIABILITIES AND EQUITY $62,843 $66.771 Source: Mondeliz Intomational, Inc. 2015 10-K. Type here to search e 9 WE A DENG 12:43 PM 25/10/2019
Step by Step Solution
There are 3 Steps involved in it

Get step-by-step solutions from verified subject matter experts