

Question: Hi! Can you help me answer these problems, please? 1 Which of the following statements about Type I and Type II errors is correct Type
Hi! Can you help me answer these problems, please?
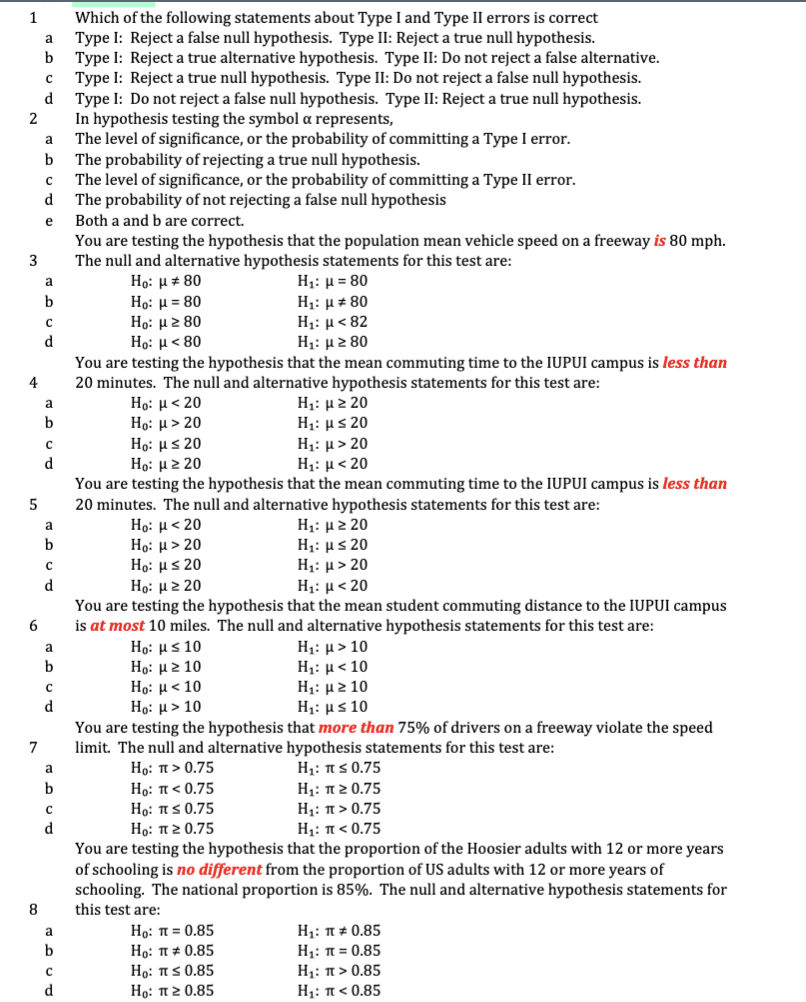
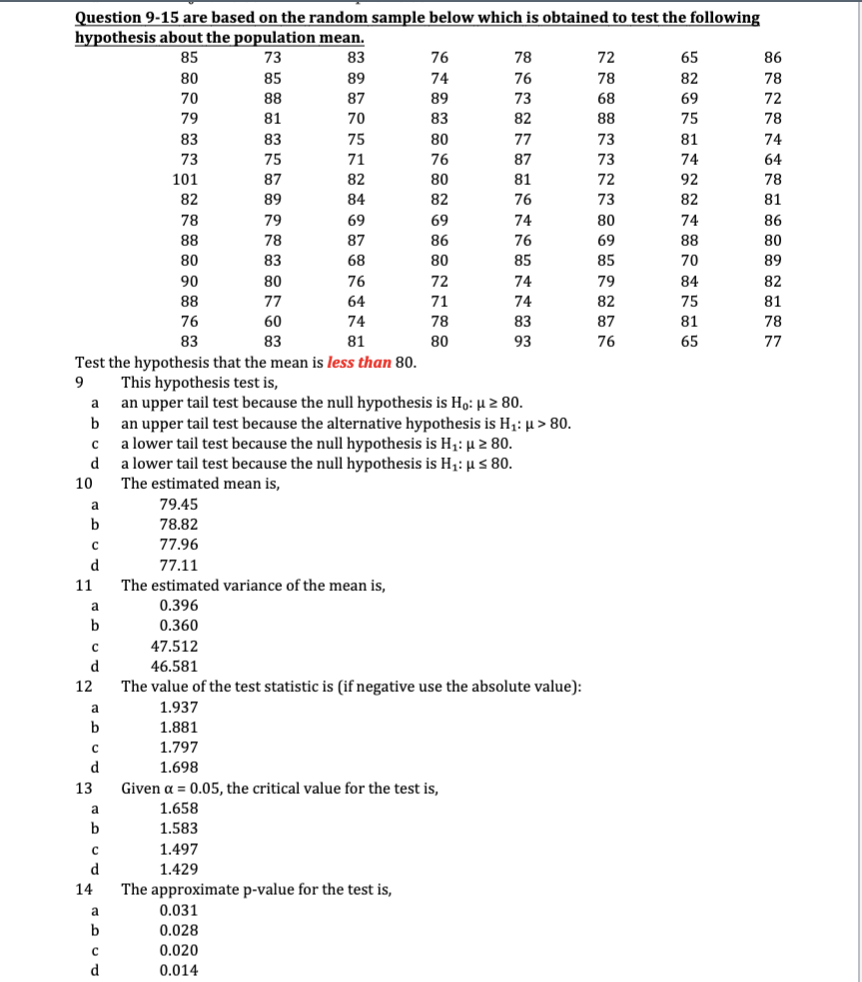
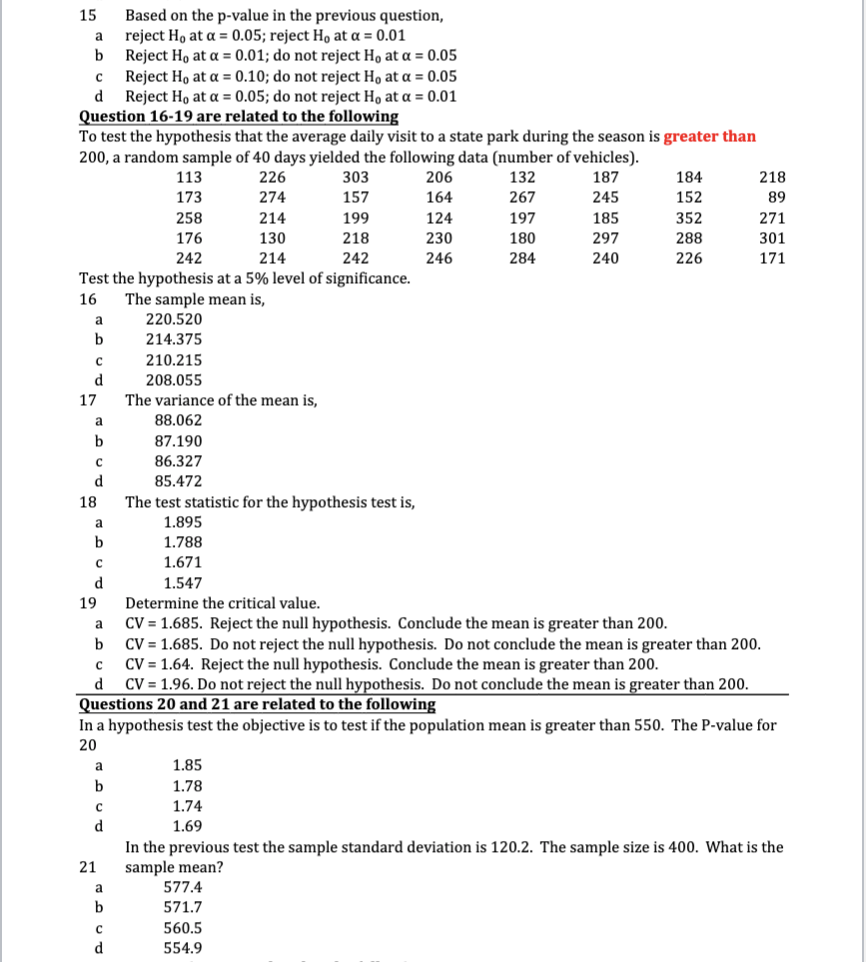
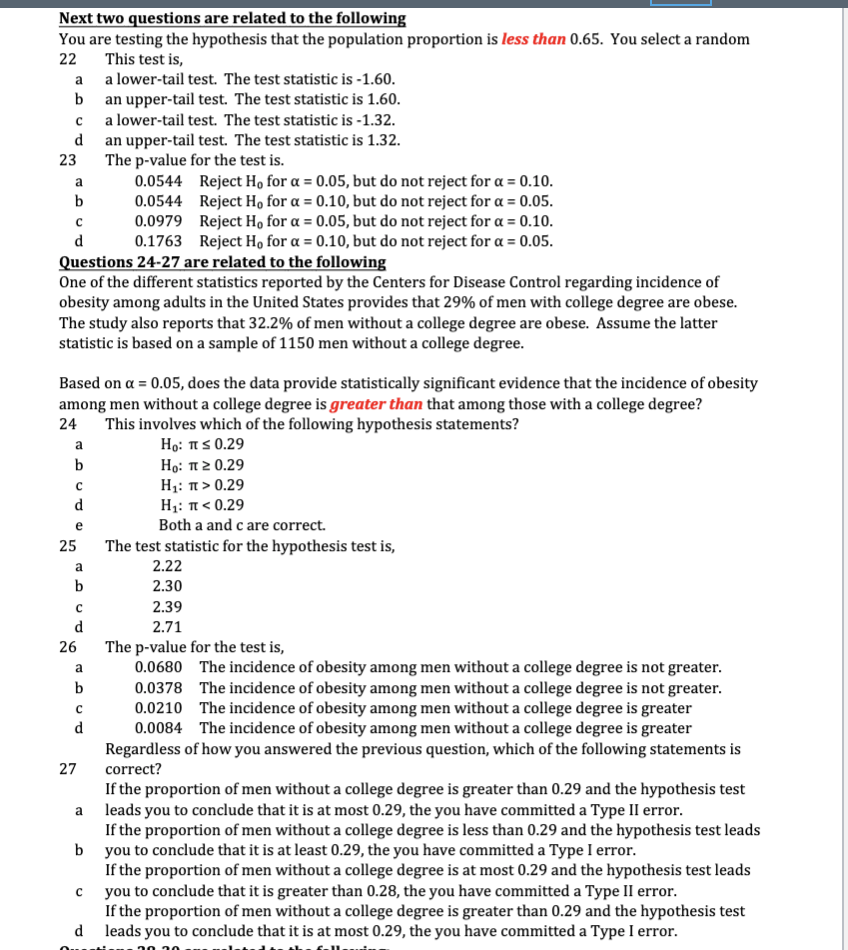
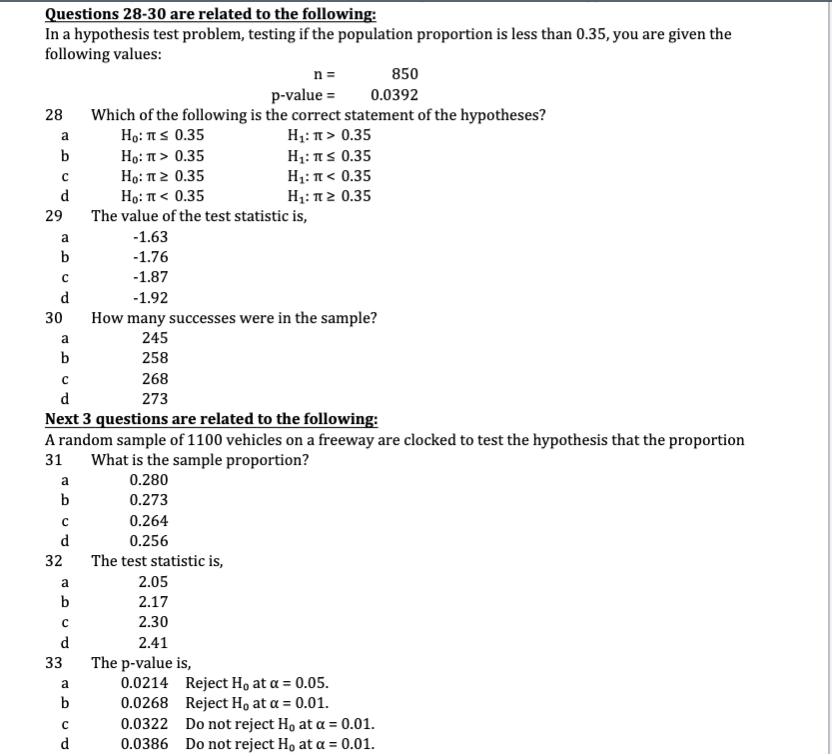
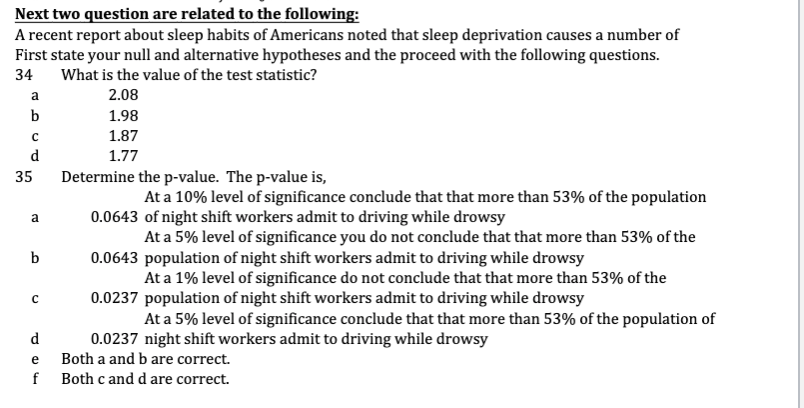
1 Which of the following statements about Type I and Type II errors is correct Type I: Reject a false null hypothesis. Type II: Reject a true null hypothesis. Type I: Reject a true alternative hypothesis. Type II: Do not reject a false alternative. Type I: Reject a true null hypothesis. Type II: Do not reject a false null hypothesis. d Type I: Do not reject a false null hypothesis. Type II: Reject a true null hypothesis. 2 In hypothesis testing the symbol a represents, a The level of significance, or the probability of committing a Type I error. The probability of rejecting a true null hypothesis. The level of significance, or the probability of committing a Type II error. The probability of not rejecting a false null hypothesis e Both a and b are correct. You are testing the hypothesis that the population mean vehicle speed on a freeway is 80 mph. W The null and alternative hypothesis statements for this test are: Ho: H # 80 H1: H = 80 Ho: H = 80 H1: H # 80 Ho: H 2 80 H1: H 20 H1: H S 20 Ho: HS 20 H1: H > 20 Ho: H 2 20 H1: H 20 H1: HS 20 Ho: HS 20 H1: H > 20 Ho: H 2 20 H1: H 10 Ho: H 2 10 H1: p 10 H1: us 10 You are testing the hypothesis that more than 75% of drivers on a freeway violate the speed limit. The null and alternative hypothesis statements for this test are: Ho: TT > 0.75 H1: It S 0.75 Ho: IT 0.75 Ho: It 2 0.75 H1: IT 0.85 Ho: It 2 0.85 H1: It 80. a lower tail test because the null hypothesis is H1: p 2 80. d a lower tail test because the null hypothesis is H,: u s 80. The estimated mean is, a 79.45 78.82 77.96 77.11 11 The estimated variance of the mean is, a 0.396 0.360 47.512 46.581 12 The value of the test statistic is (if negative use the absolute value): 1.937 1.881 1.797 1.698 13 Given a = 0.05, the critical value for the test is, 1.658 1.583 1.497 1.429 14 The approximate p-value for the test is, 0.031 0.028 0.020 0.01415 Based on the p-value in the previous question, reject Ho at a = 0.05; reject Ho at a = 0.01 Reject Ho at a = 0.01; do not reject Ho at a = 0.05 Reject Ho at a = 0.10; do not reject Ho at a = 0.05 Reject Ho at a = 0.05; do not reject Ho at a = 0.01 Question 16-19 are related to the following To test the hypothesis that the average daily visit to a state park during the season is greater than 200, a random sample of 40 days yielded the following data (number of vehicles). 113 226 303 206 132 187 184 218 173 274 157 164 267 245 152 89 258 214 199 124 197 185 352 271 176 130 218 230 180 297 288 301 242 214 242 246 284 240 226 171 Test the hypothesis at a 5% level of significance. 16 The sample mean is, a 220.520 214.375 210.215 208.055 17 The variance of the mean is, 88.062 87.190 86.327 85.472 18 The test statistic for the hypothesis test is, a 1.895 1.788 1.671 1.547 19 Determine the critical value. CV = 1.685. Reject the null hypothesis. Conclude the mean is greater than 200. b CV = 1.685. Do not reject the null hypothesis. Do not conclude the mean is greater than 200. CV = 1.64. Reject the null hypothesis. Conclude the mean is greater than 200. CV = 1.96. Do not reject the null hypothesis. Do not conclude the mean is greater than 200. Questions 20 and 21 are related to the following In a hypothesis test the objective is to test if the population mean is greater than 550. The P-value for 20 1.85 1.78 1.74 1.69 In the previous test the sample standard deviation is 120.2. The sample size is 400. What is the 21 sample mean? 577.4 571.7 560.5 554.9Next two questions are related to the following You are testing the hypothesis that the population proportion is less than 0.65. You select a random 22 This test is, a a lower-tail test. The test statistic is -1.60. an upper-tail test. The test statistic is 1.60. a lower-tail test. The test statistic is -1.32. d an upper-tail test. The test statistic is 1.32. 23 The p-value for the test is. 0.0544 Reject Ho for a = 0.05, but do not reject for a = 0.10. 0.0544 Reject Ho for a = 0.10, but do not reject for a = 0.05. 0.0979 Reject Ho for a = 0.05, but do not reject for a = 0.10. 0.1763 Reject Ho for a = 0.10, but do not reject for a = 0.05. Questions 24-27 are related to the following One of the different statistics reported by the Centers for Disease Control regarding incidence of obesity among adults in the United States provides that 29% of men with college degree are obese. The study also reports that 32.2% of men without a college degree are obese. Assume the latter statistic is based on a sample of 1150 men without a college degree. Based on a = 0.05, does the data provide statistically significant evidence that the incidence of obesity among men without a college degree is greater than that among those with a college degree? 24 This involves which of the following hypothesis statements? a Ho: IT S 0.29 Ho: It 2 0.29 H1: IT > 0.29 H1: IT 0.35 Ho: IT > 0.35 H1: I S 0.35 Ho: 1 2 0.35 H1: IT
Step by Step Solution
There are 3 Steps involved in it

Get step-by-step solutions from verified subject matter experts