

Question: Hi, Could hep me solve this question please? Thanks, Question 4 [8 points] A firm's ATC, AVC, and MC curves are shown in the graph
Hi,
Could hep me solve this question please?
Thanks,
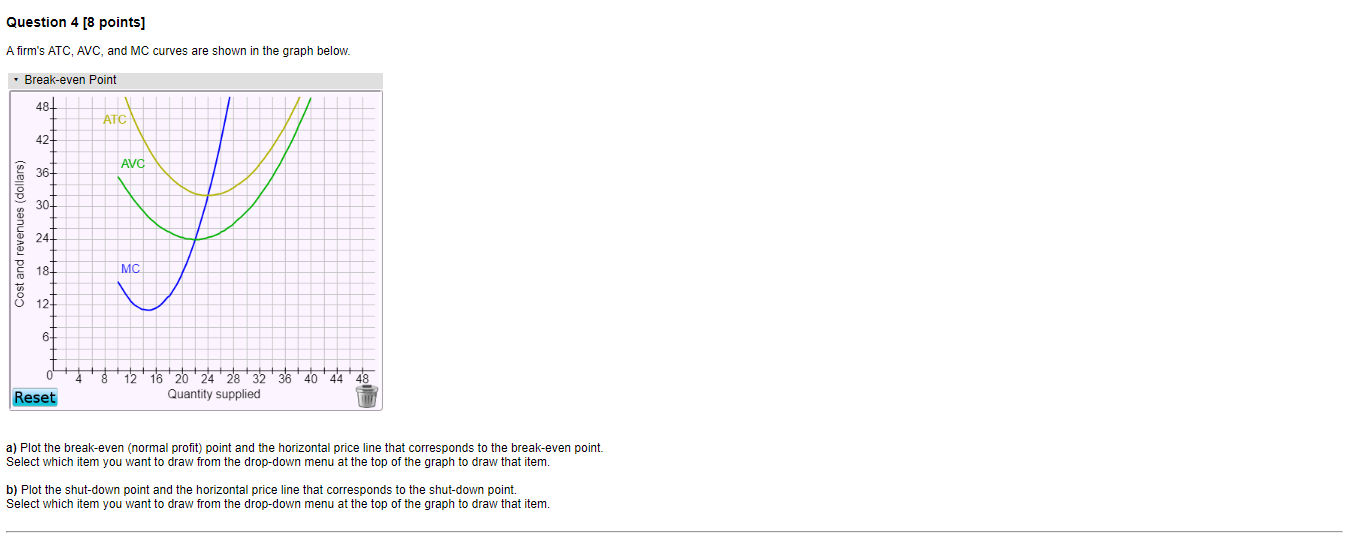
Question 4 [8 points] A firm's ATC, AVC, and MC curves are shown in the graph below. . Break-even Point 48 42 Cost and revenues (dollars) 36- 30 187 8 12 16 20 24 28 32 36 40 44 48 Reset Quantity supplied a) Plot the break-even (normal profit) point and the horizontal price line that corresponds to the break-even point. Select which item you want to draw from the drop-down menu at the top of the graph to draw that item. b) Plot the shut-down point and the horizontal price line that corresponds to the shut-down point. Select which item you want to draw from the drop-down menu at the top of the graph to draw that item
Step by Step Solution
There are 3 Steps involved in it

Get step-by-step solutions from verified subject matter experts