

Question: Hi could you help me with this question 75% EE View Zoom Add Category Insert Table Ch + Sheet1 #1 #2 #3 #4 INPUTS ARE
Hi could you help me with this question

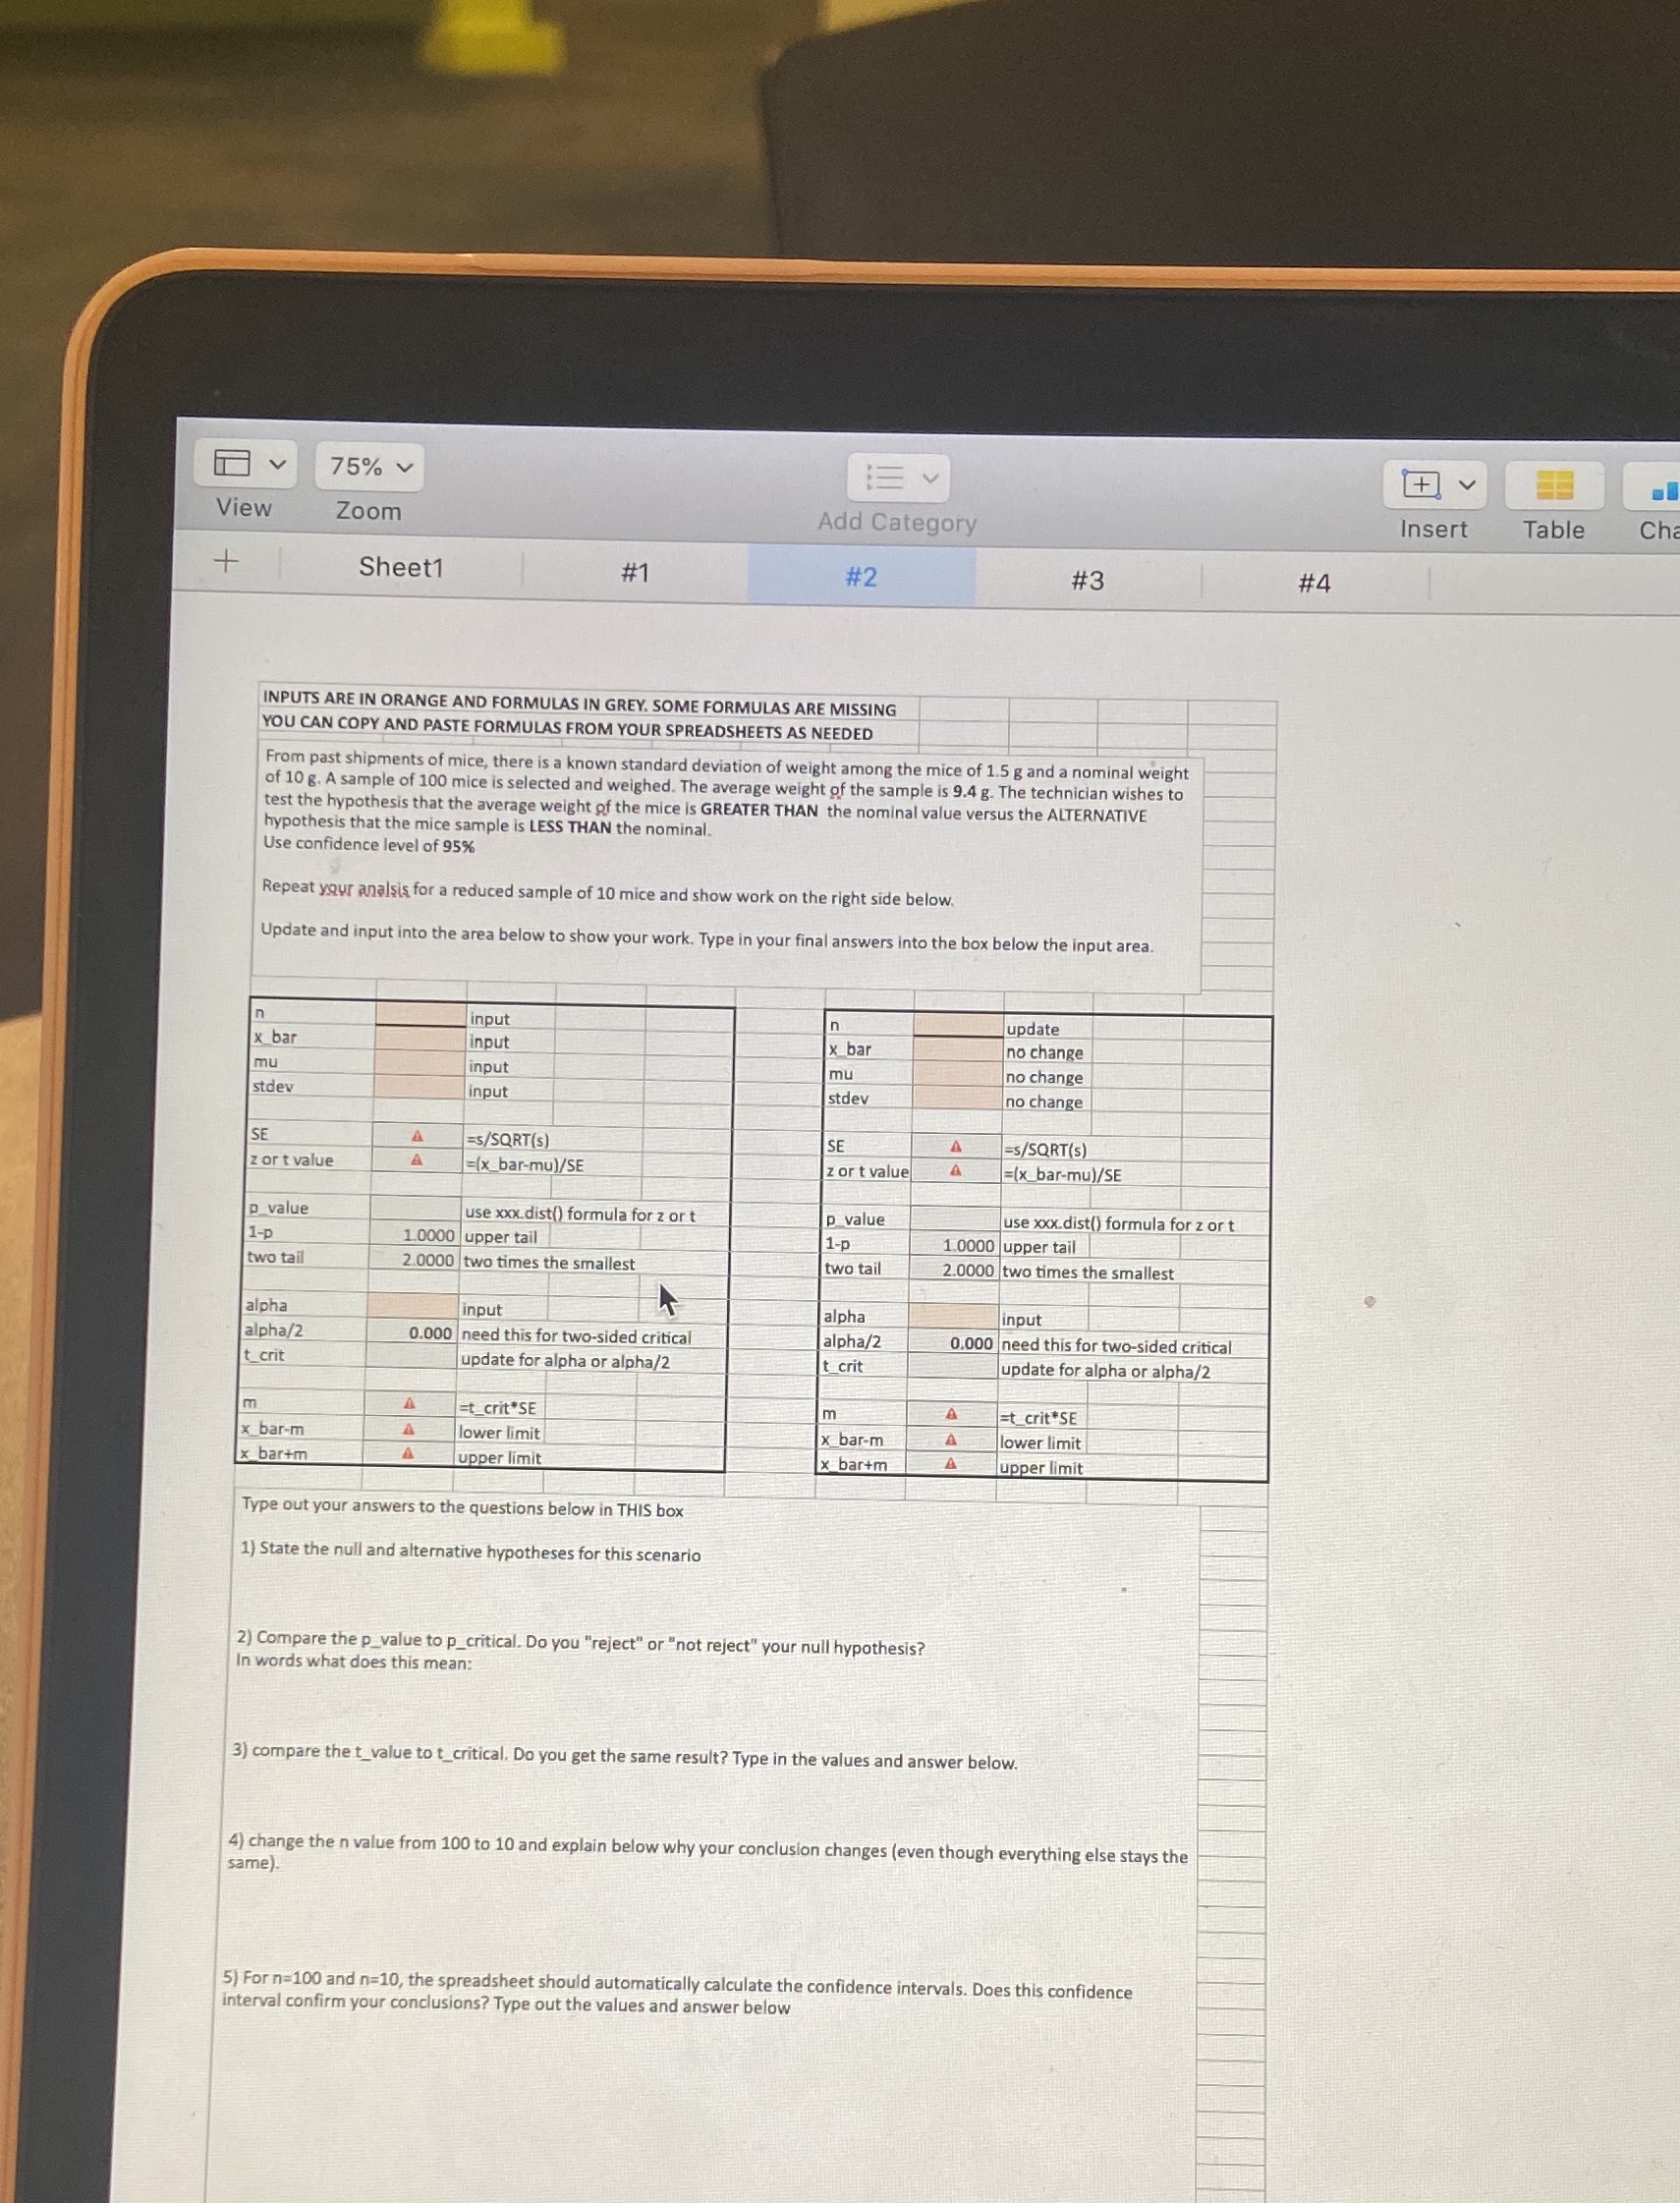
75% EE View Zoom Add Category Insert Table Ch + Sheet1 #1 #2 #3 #4 INPUTS ARE IN ORANGE AND FORMULAS IN GREY. SOME FORMULAS ARE MISSING YOU CAN COPY AND PASTE FORMULAS FROM YOUR SPREADSHEETS AS NEEDED From past shipments of mice, there is a known standard deviation of weight among the mice of 1.5 g and a nominal weight of 10 g. A sample of 100 mice is selected and weighed. The average weight of the sample is 9.4 g. The technician wishes to test the hypothesis that the average weight of the mice is GREATER THAN the nominal value versus the ALTERNATIVE hypothesis that the mice sample is LESS THAN the nominal. Use confidence level of 95% Repeat your analsis for a reduced sample of 10 mice and show work on the right side below. Update and input into the area below to show your work. Type in your final answers into the box below the input area. input update x bar input x bar no change mu input mu no change stdev input stdev no change SE =S/SQRT(S) 4 =s/SQRT(5) z or t value =(x_bar-mu)/SE z or t value =(x_bar-mu)/SE p value use xxx.dist() formula for z ort p value use xxx.dist() formula for zort 1-p 1.0000 upper tail 1-p 10000 upper tail two tail 2.0000 two times the smallest two tail 2.0000 two times the smallest alpha input alpha alpha/2 0.000 need this for two-sided critical alpha/2 0.000 need this for two-sided critical t_crit update for alpha or alpha/2 crit update for alpha or alpha/2 m =t_crit*SE m Et crit*SE x bar-m lower limit
Step by Step Solution
There are 3 Steps involved in it

Get step-by-step solutions from verified subject matter experts