

Question: Hi could you help solving this problem please? 5) In the instructor video, titration curves and first derivative graphs (slope plots) are shown for a
Hi could you help solving this problem please?
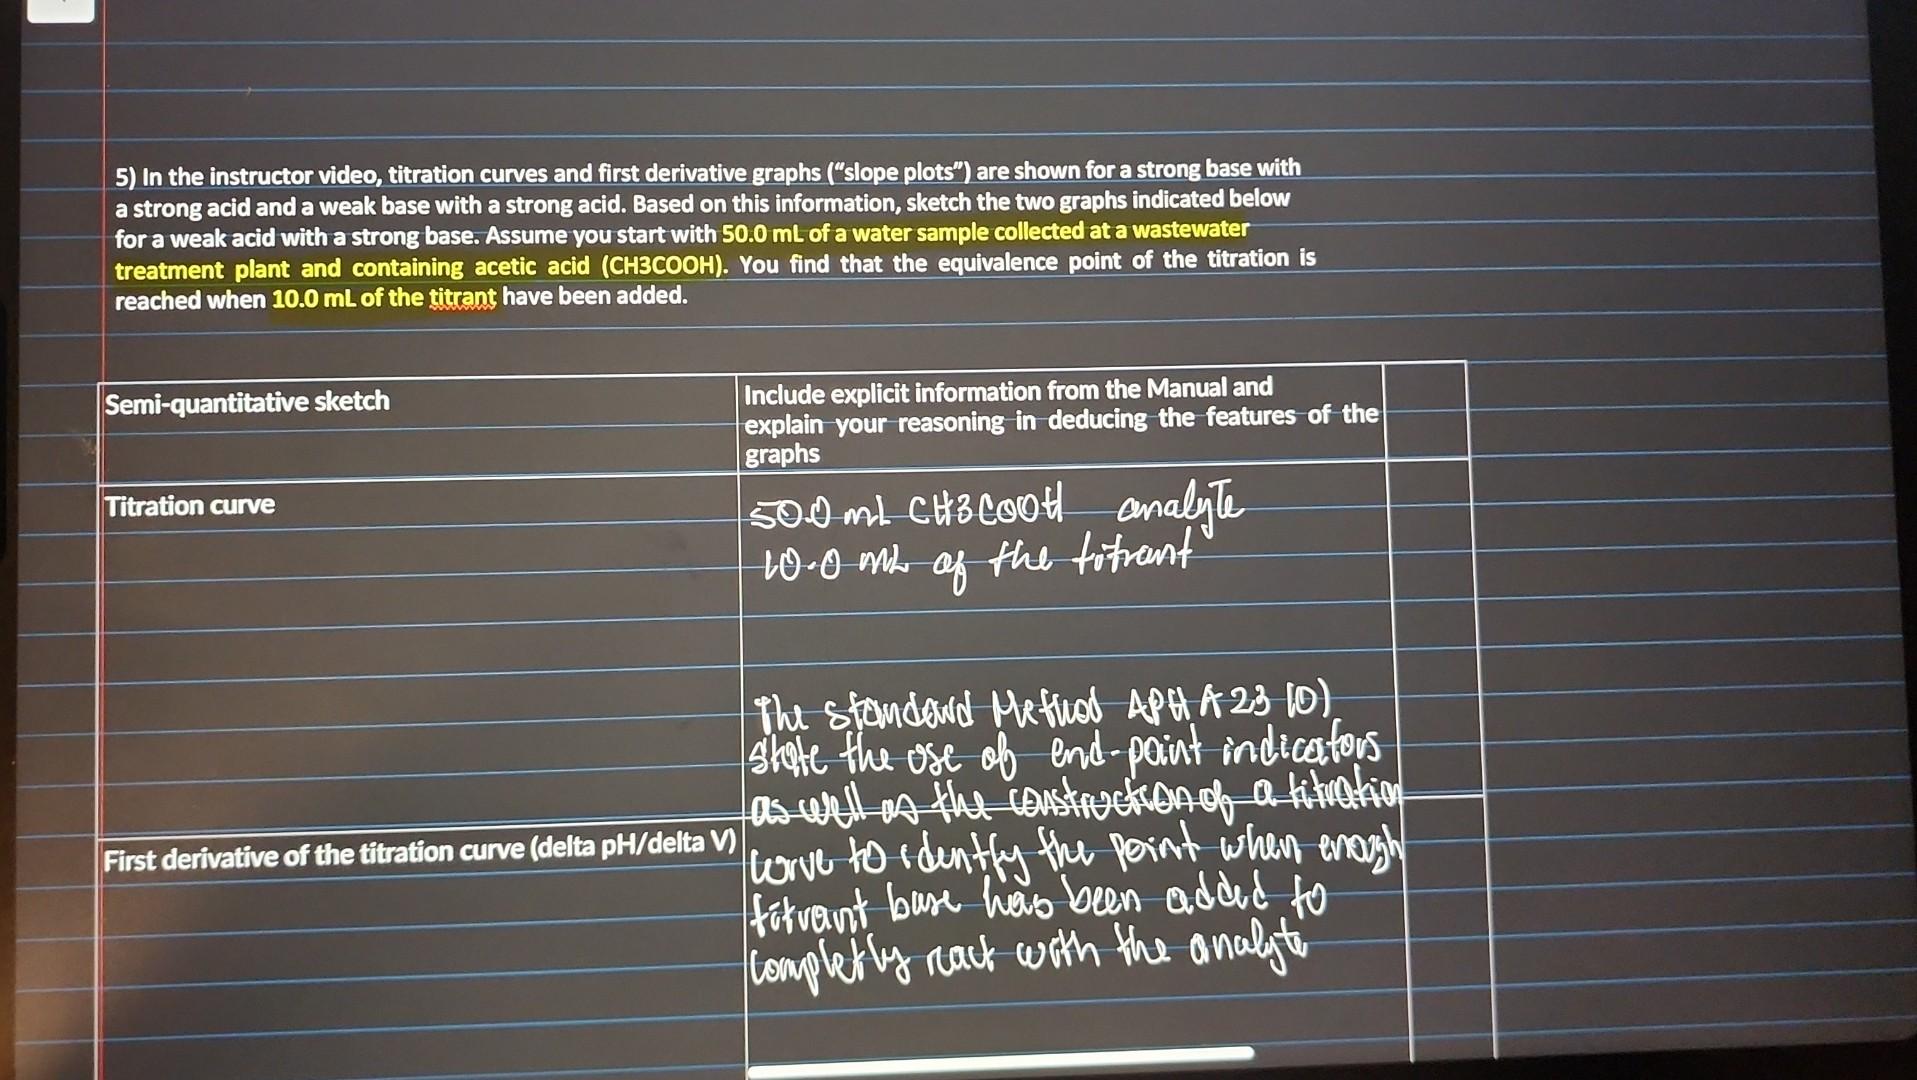
5) In the instructor video, titration curves and first derivative graphs ("slope plots") are shown for a strong base with a strong acid and a weak base with a strong acid. Based on this information, sketch the two graphs indicated below for a weak acid with a strong base. Assume you start with 50.0mL of a water sample collected at a wastewater treatment plant and containing acetic acid (CH3COOH). You find that the equivalence point of the titration is reached when 10.0mL of the titrant have been added
Step by Step Solution
There are 3 Steps involved in it
1 Expert Approved Answer
Step: 1 Unlock

Question Has Been Solved by an Expert!
Get step-by-step solutions from verified subject matter experts
Step: 2 Unlock
Step: 3 Unlock