

Question: Hi expert only answer please no explanation for anyone required Question 1 1 point possible (graded) The histogram below shows our small sample of 100
Hi expert only answer please no explanation for anyone required
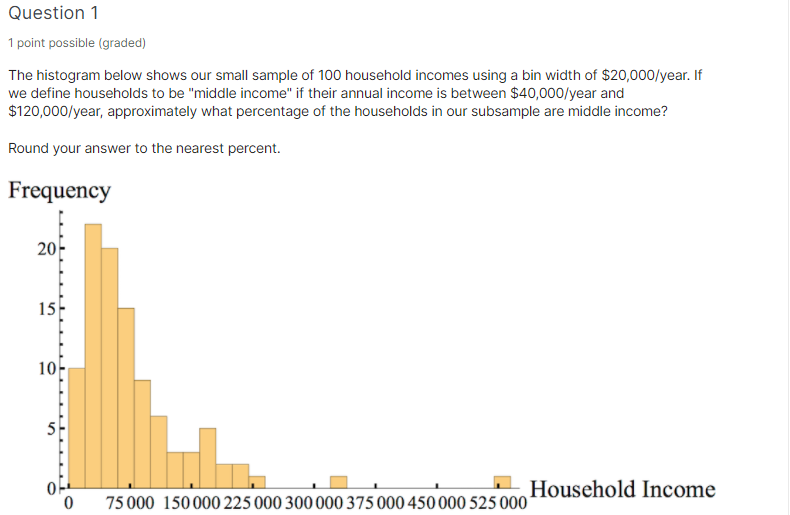
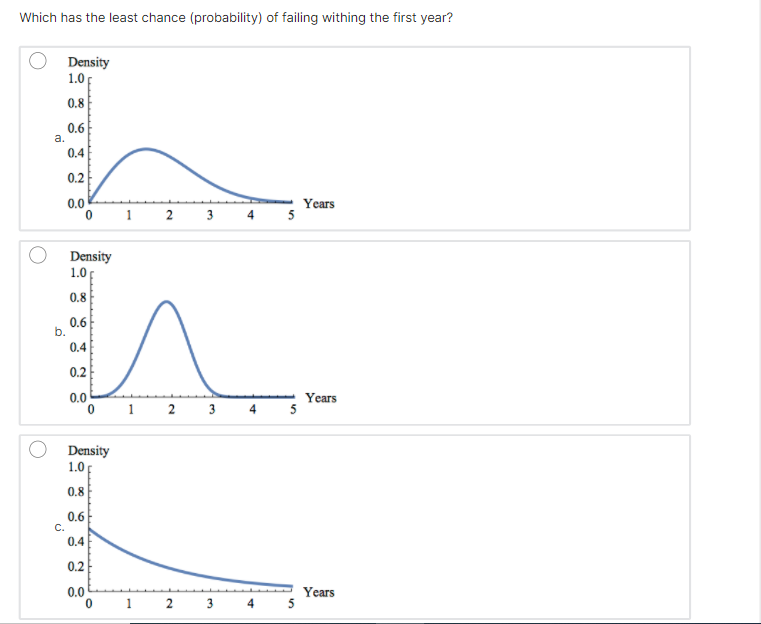
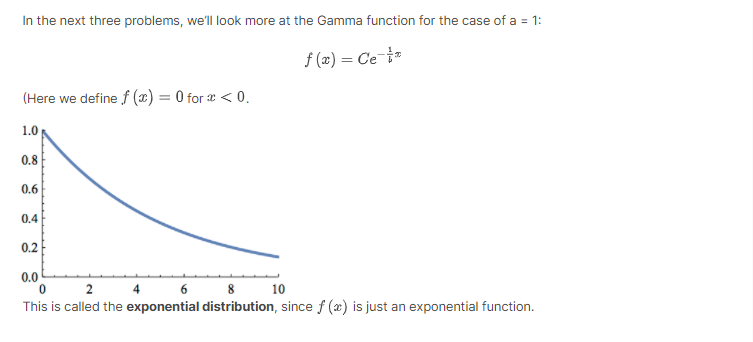
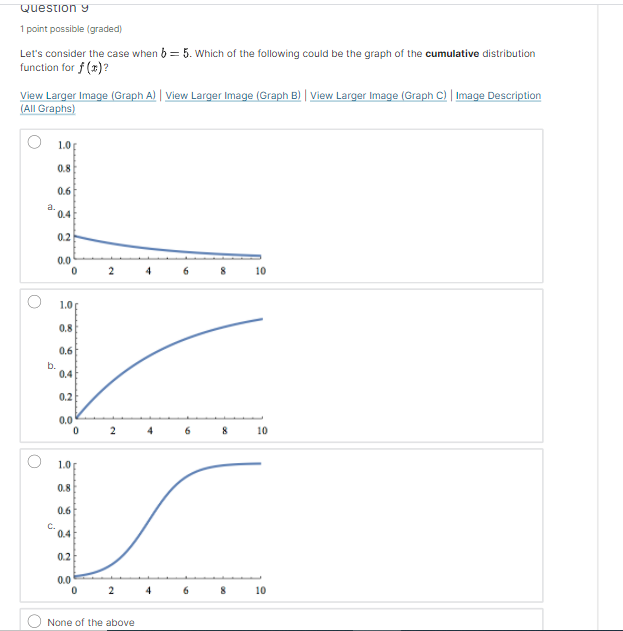
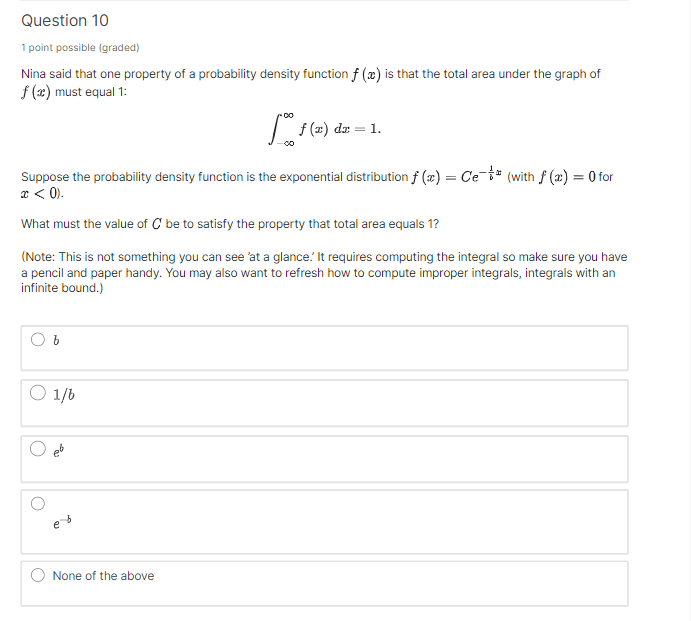
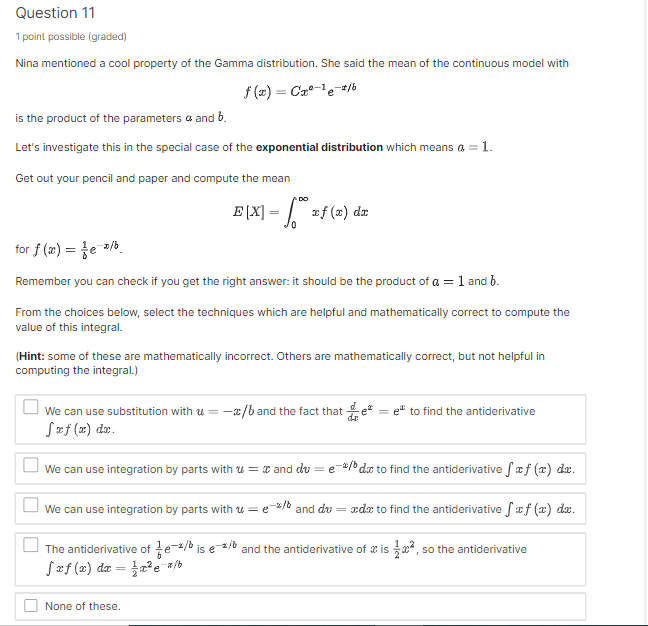
Question 1 1 point possible (graded) The histogram below shows our small sample of 100 household incomes using a bin width of $20,000/year. If we define households to be "middle income" if their annual income is between $40,000/year and $120,000/year, approximately what percentage of the households in our subsample are middle income? Round your answer to the nearest percent. Frequency 201 15 - 10- 5 0 T Household Income 0 75 000 150 000 225 000 300 000 375 000 450 000 525 000Which has the least chance (probability) of failing withing the first year? O Density 1.0r 0.8 0.6 a. 0.4 0.2 0.0 Years 0 1 2 3 4 5 O Density 1.0[ 0.8 b. 0.6 0.4 0.2 0.0 Years 0 1 2 3 4 5 O Density 1.0[ 0.8 0.6 C. 0.4 0.2 0.0 Years 0 1 2 3 4 5In the next three problems, we'll look more at the Gamma function for the case of a = 1: f (z) = Ce iz (Here we define if (@) = 0 for x
Step by Step Solution
There are 3 Steps involved in it

Get step-by-step solutions from verified subject matter experts