

Question: Hi, here is the question I am trying to solve for: This is what I have tried below: I'm just having a hard time getting
Hi, here is the question I am trying to solve for:
This is what I have tried below:
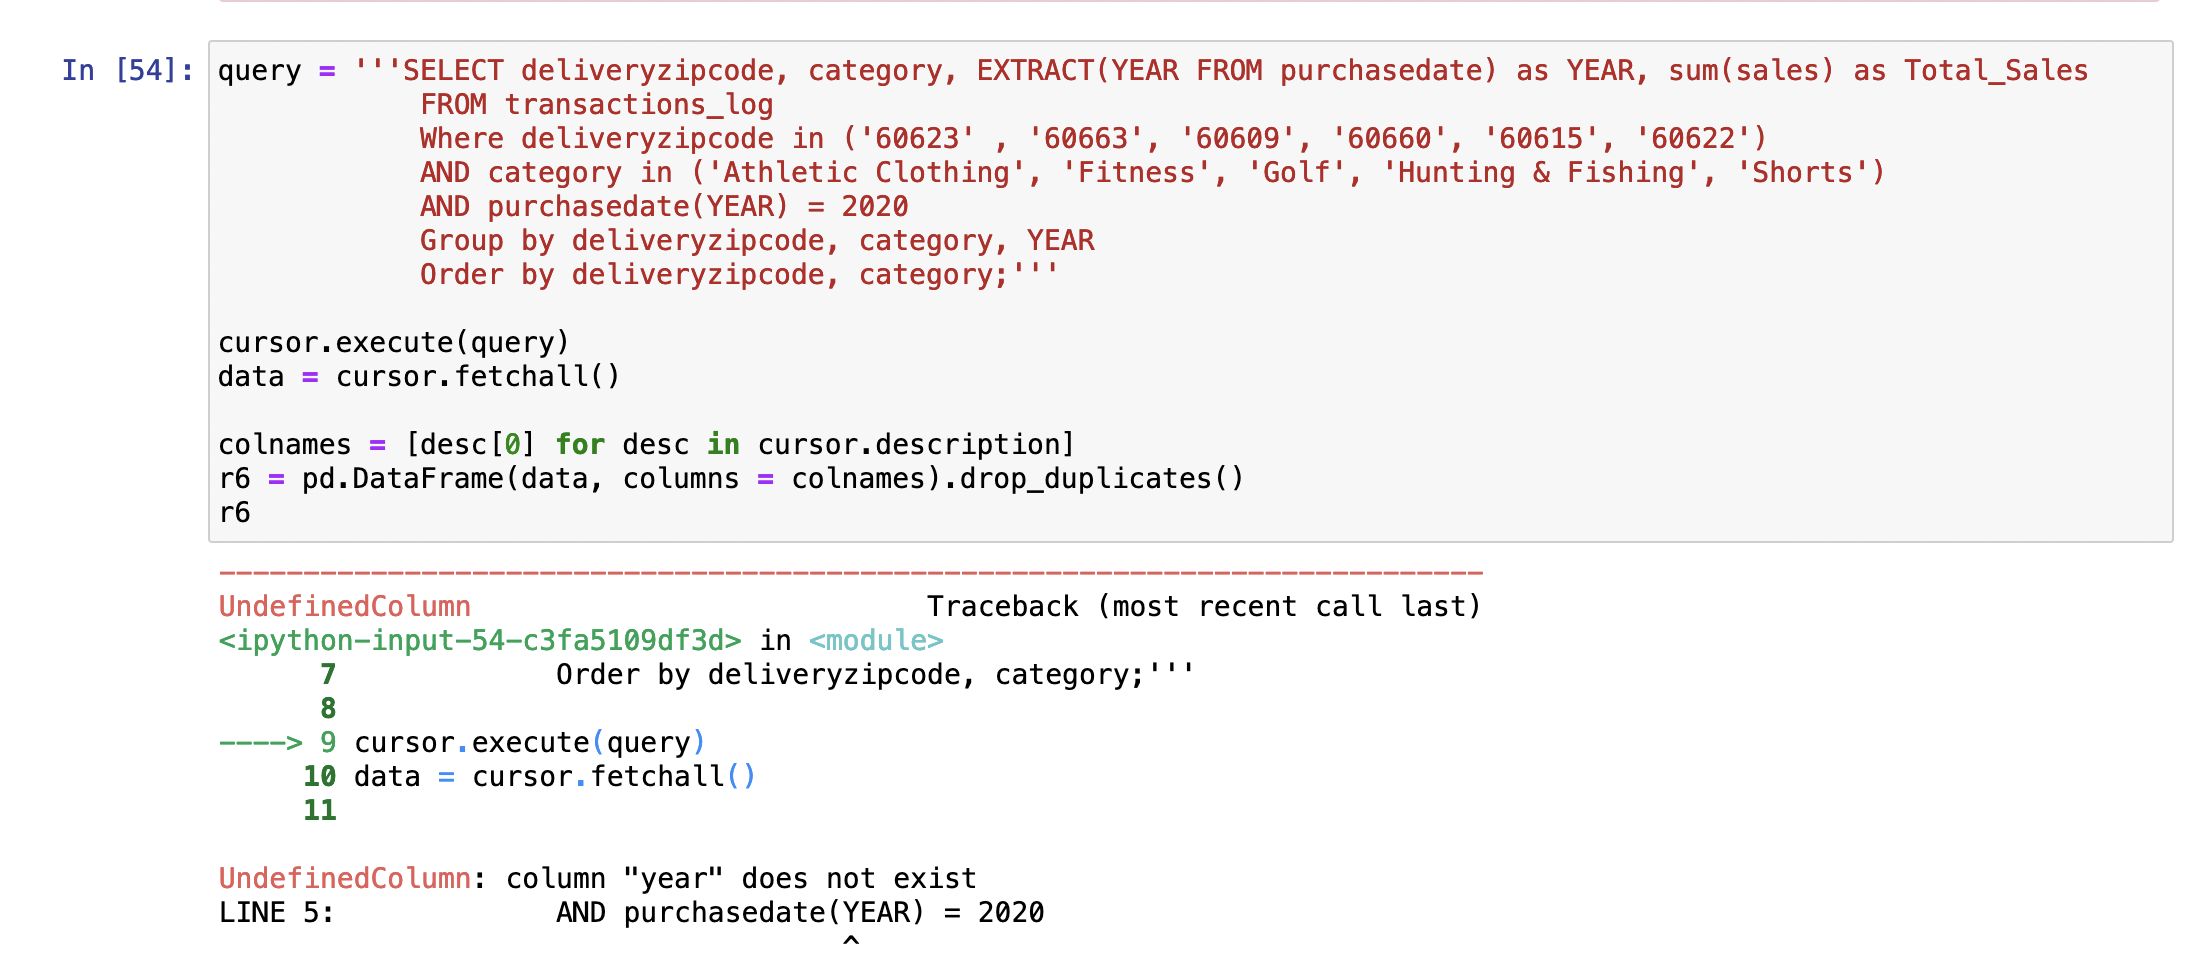
I'm just having a hard time getting the correct year. Without the year filter everything else runs fine so this part is my issue. Any help is appreciated!
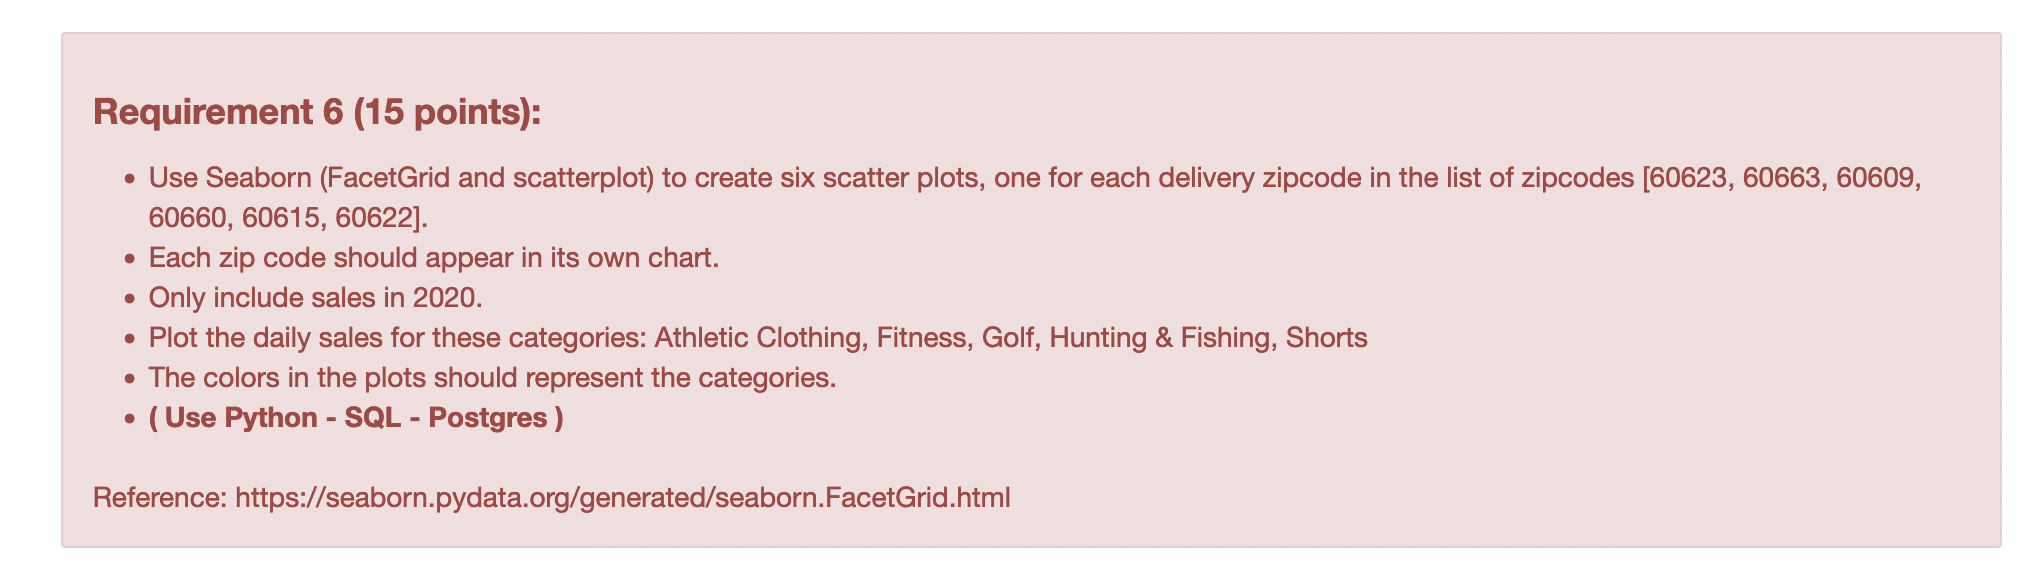
Requirement 6 (15 points): - Use Seaborn (FacetGrid and scatterplot) to create six scatter plots, one for each delivery zipcode in the list of zipcodes [60623, 60663, 60609, 60660, 60615, 60622]. - Each zip code should appear in its own chart. - Only include sales in 2020. - Plot the daily sales for these categories: Athletic Clothing, Fitness, Golf, Hunting \& Fishing, Shorts - The colors in the plots should represent the categories. - ( Use Python - SQL - Postgres ) Reference: https://seaborn.pydata.org/generated/seaborn.FacetGrid.html
Step by Step Solution
There are 3 Steps involved in it

Get step-by-step solutions from verified subject matter experts