Question: Hi I need a graph or chart on excel or word according to this data and dates. 9/18/2020 9/28/2020 10/26/2020 1/14/2021 2/26/21 3/19/21 4/2/21 02/4/22

Hi I need a graph or chart on excel or word according to this data and dates.Hi I need a graph or chart on excel or word

9/18/2020 9/28/2020 10/26/2020 1/14/2021 2/26/21 3/19/21 4/2/21 02/4/22 1. Receive Customer PO: 2. Receive Customer Data: 3. Product Concept Review: 4. Schematic Generation: 5. Customer Approval- Schematic/Placement: 6. Substrate Routing Completion: 7. Customer/Supplier Approval-Routing: 8. Receive Substrates: 9. Test a. Test Schematic: b. Test PCB Routing: c. Test PCB Assembly: d. Test Development Complete: 10. Prototype a. Prototype Build: b. Prototype Test: c. Prototype Ship: 02/22/2021 03/8/20211 1/14/22 1/28/22 02/25/22 03/25/22 03/25/22

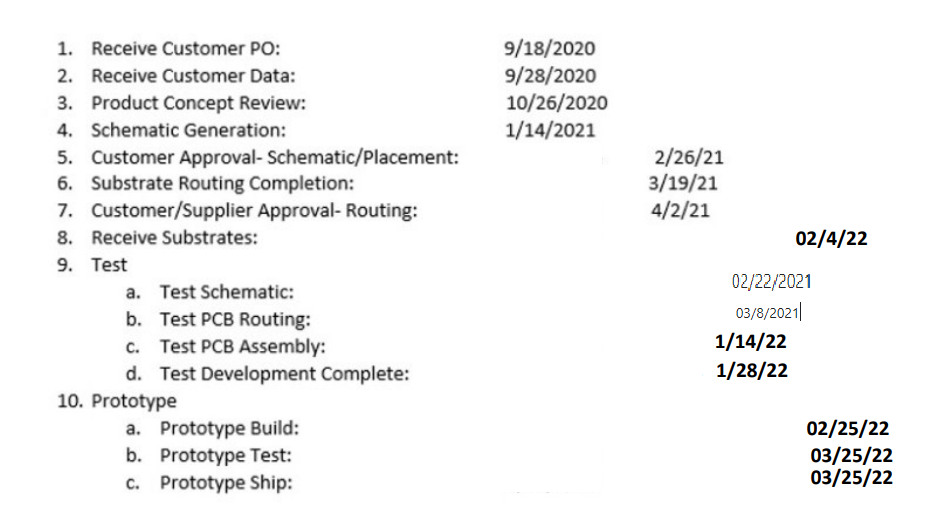
Step by Step Solution

There are 3 Steps involved in it

1 Expert Approved Answer
Step: 1 Unlock blur-text-image
Question Has Been Solved by an Expert!

Get step-by-step solutions from verified subject matter experts

Step: 2 Unlock
Step: 3 Unlock

Students Have Also Explored These Related General Management Questions!