

Question: HI, look at the graph to answer the question. Also show me free market equilibrium and cartel. 4. The oil cartel The Organization of Petroleum
HI, look at the graph to answer the question. Also show me free market equilibrium and cartel.
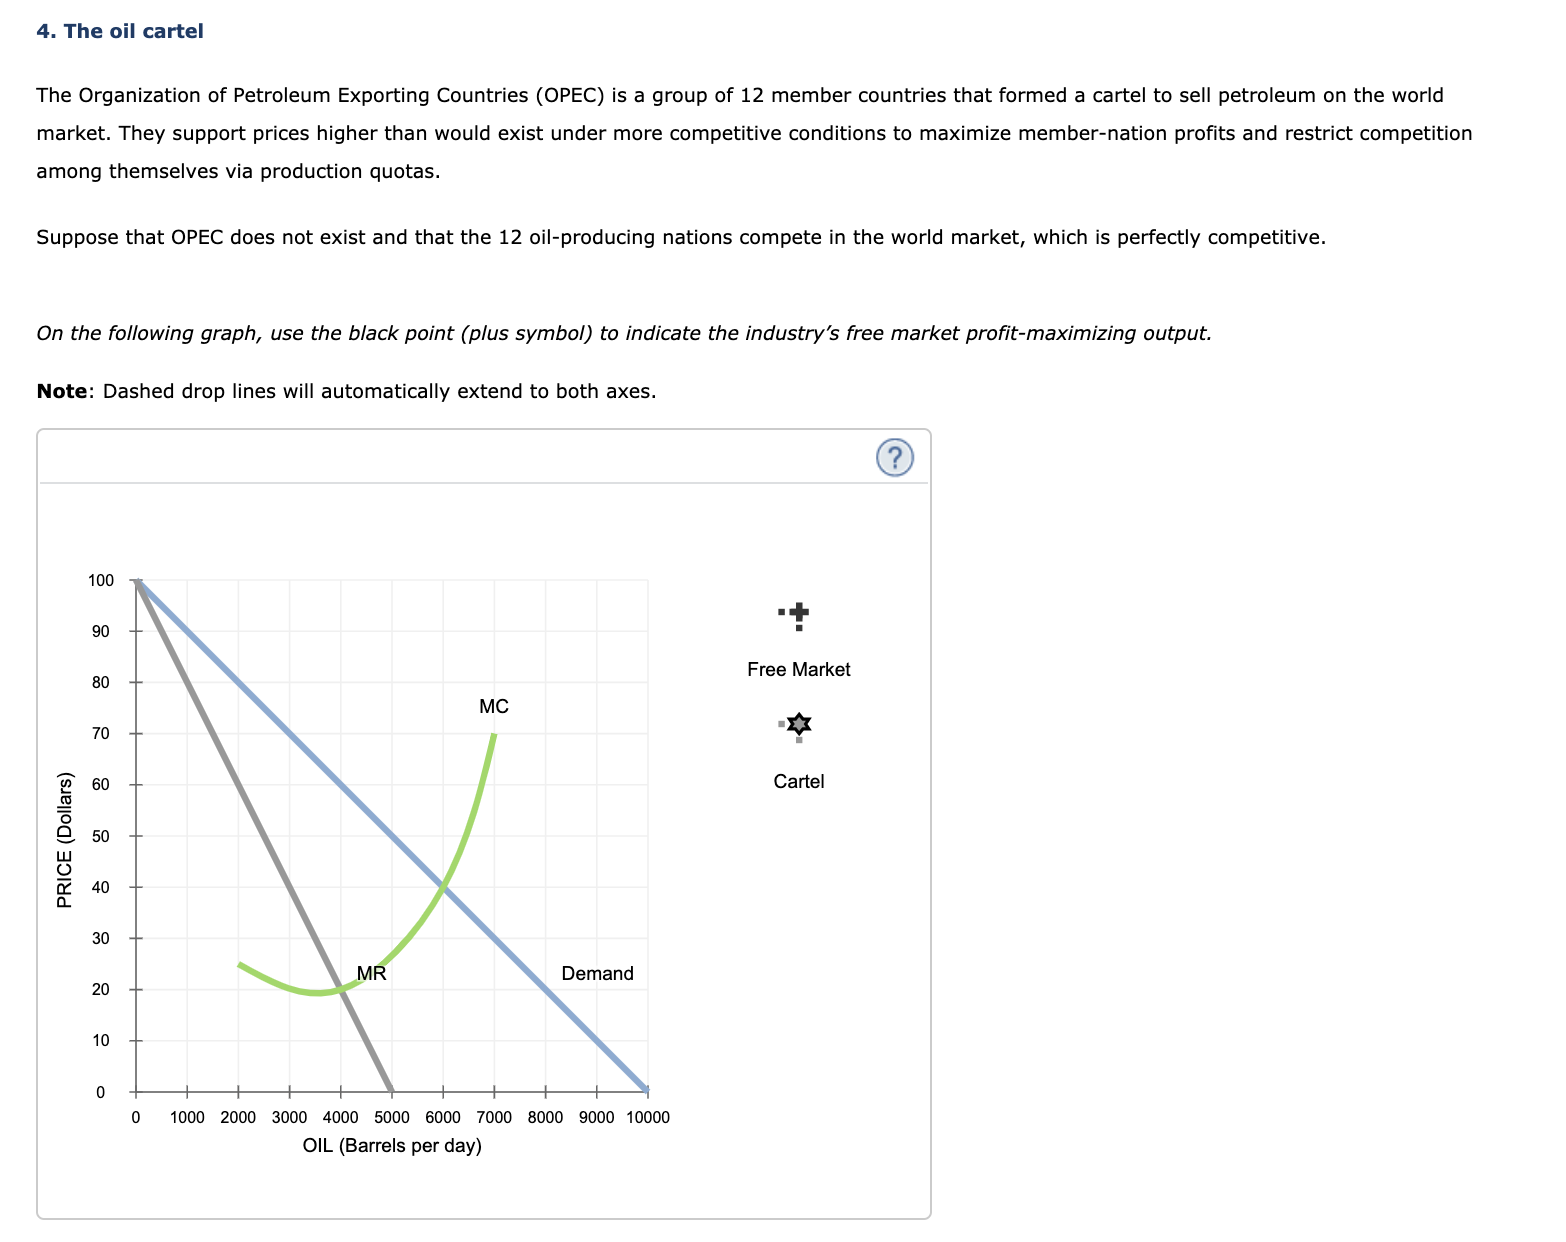
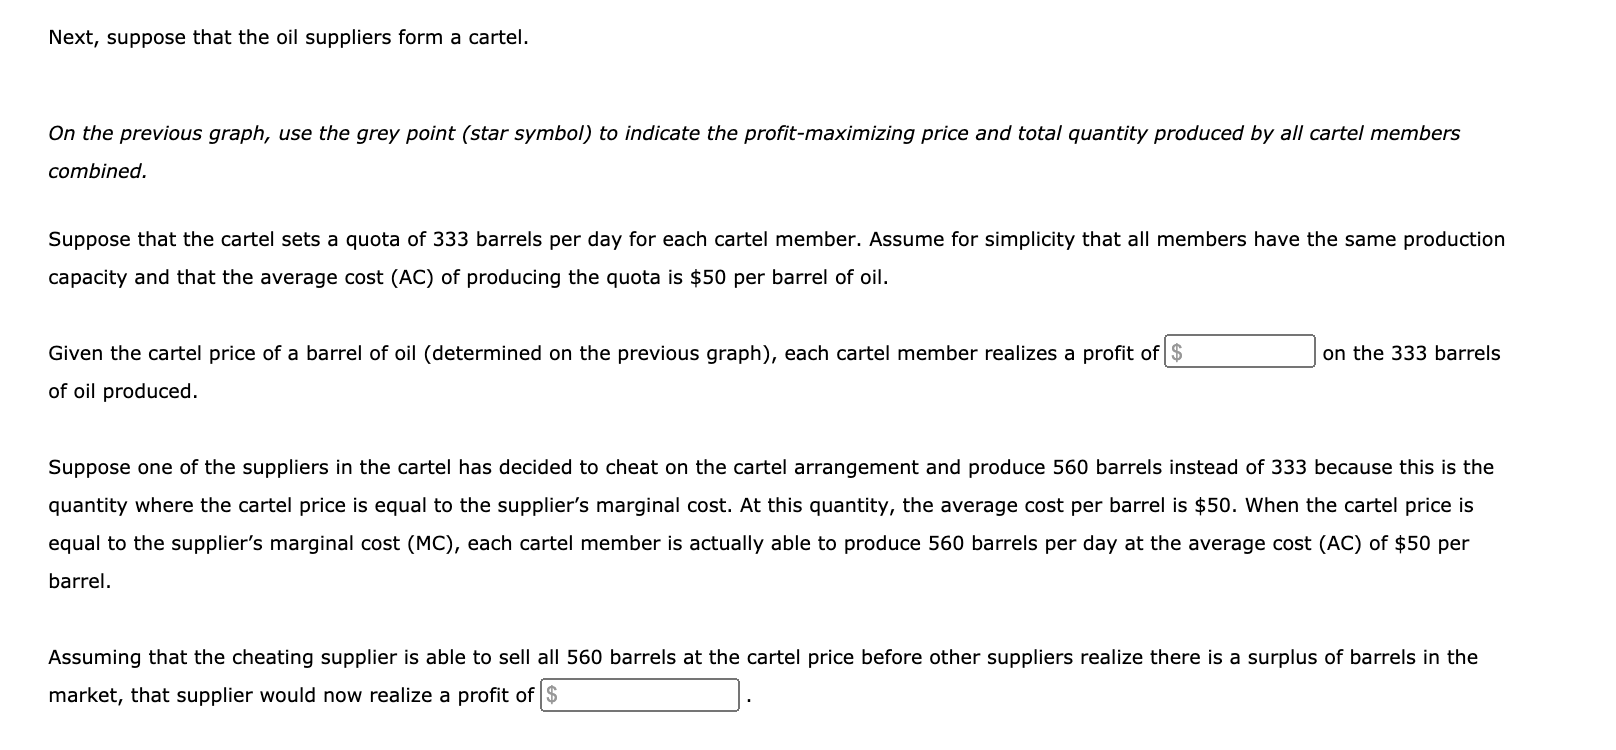
4. The oil cartel The Organization of Petroleum Exporting Countries (OPEC) is a group of 12 member countries that formed a cartel to sell petroleum on the world market. They support prices higher than would exist under more competitive conditions to maximize member-nation prots and restrict competition among themselves via production quotas. Suppose that OPEC does not exist and that the 12 oil-producing nations compete in the world market, which is perfectly competitive. On the following graph, use the black paint (plus symbol) to indicate the industry's free market profit-maximizing output. Note: Dashed drop lines will automatically extend to both axes. 100 - -|- 90 . Free Market 80 MC 70 ' 60 Cartel 40 PRICE (Dollars) 8 Demand 20 10 0 1000 2000 3000 4000 5000 6000 7000 5000 9000 10000 OIL (Barrels per day) Next, suppose that the oil suppliers form a cartel. On the previous graph, use the grey point (star symbol) to indicate the prot-maximizing price and total quantity produced by all cartel members combined. Suppose that the cartel sets a quota of 333 barrels per day for each cartel member. Assume for simplicity that all members have the same production capacity and that the average cost (AC) of producing the quota is $50 per barrel of oil. Given the cartel price of a barrel of oil (determined on the previous graph), each cartel member realizes a prot of_ on the 333 barrels of oil produced. Suppose one of the suppliers in the cartel has decided to cheat on the cartel arrangement and produce 560 barrels instead of 333 because this is the quantity where the cartel price is equal to the supplier's marginal cost. At this quantity, the average cost per barrel is $50. When the cartel price is equal to the supplier's marginal cost (MC), each cartel member is actually able to produce 560 barrels per day at the average cost (AC) of $50 per barrel. Assuming that the cheating supplier is able to sell all 560 barrels at the cartel price before other suppliers realize there is a surplus of barrels in the market, that supplier would now realize a prot 0
Step by Step Solution
There are 3 Steps involved in it

Get step-by-step solutions from verified subject matter experts