

Question: Hi, I need help with a walkthrough for the attached Excel Monte Carlo simulation problem. ? Your small biotech firm operates a flee n is
Hi,
I need help with a walkthrough for the attached Excel Monte Carlo simulation problem.?
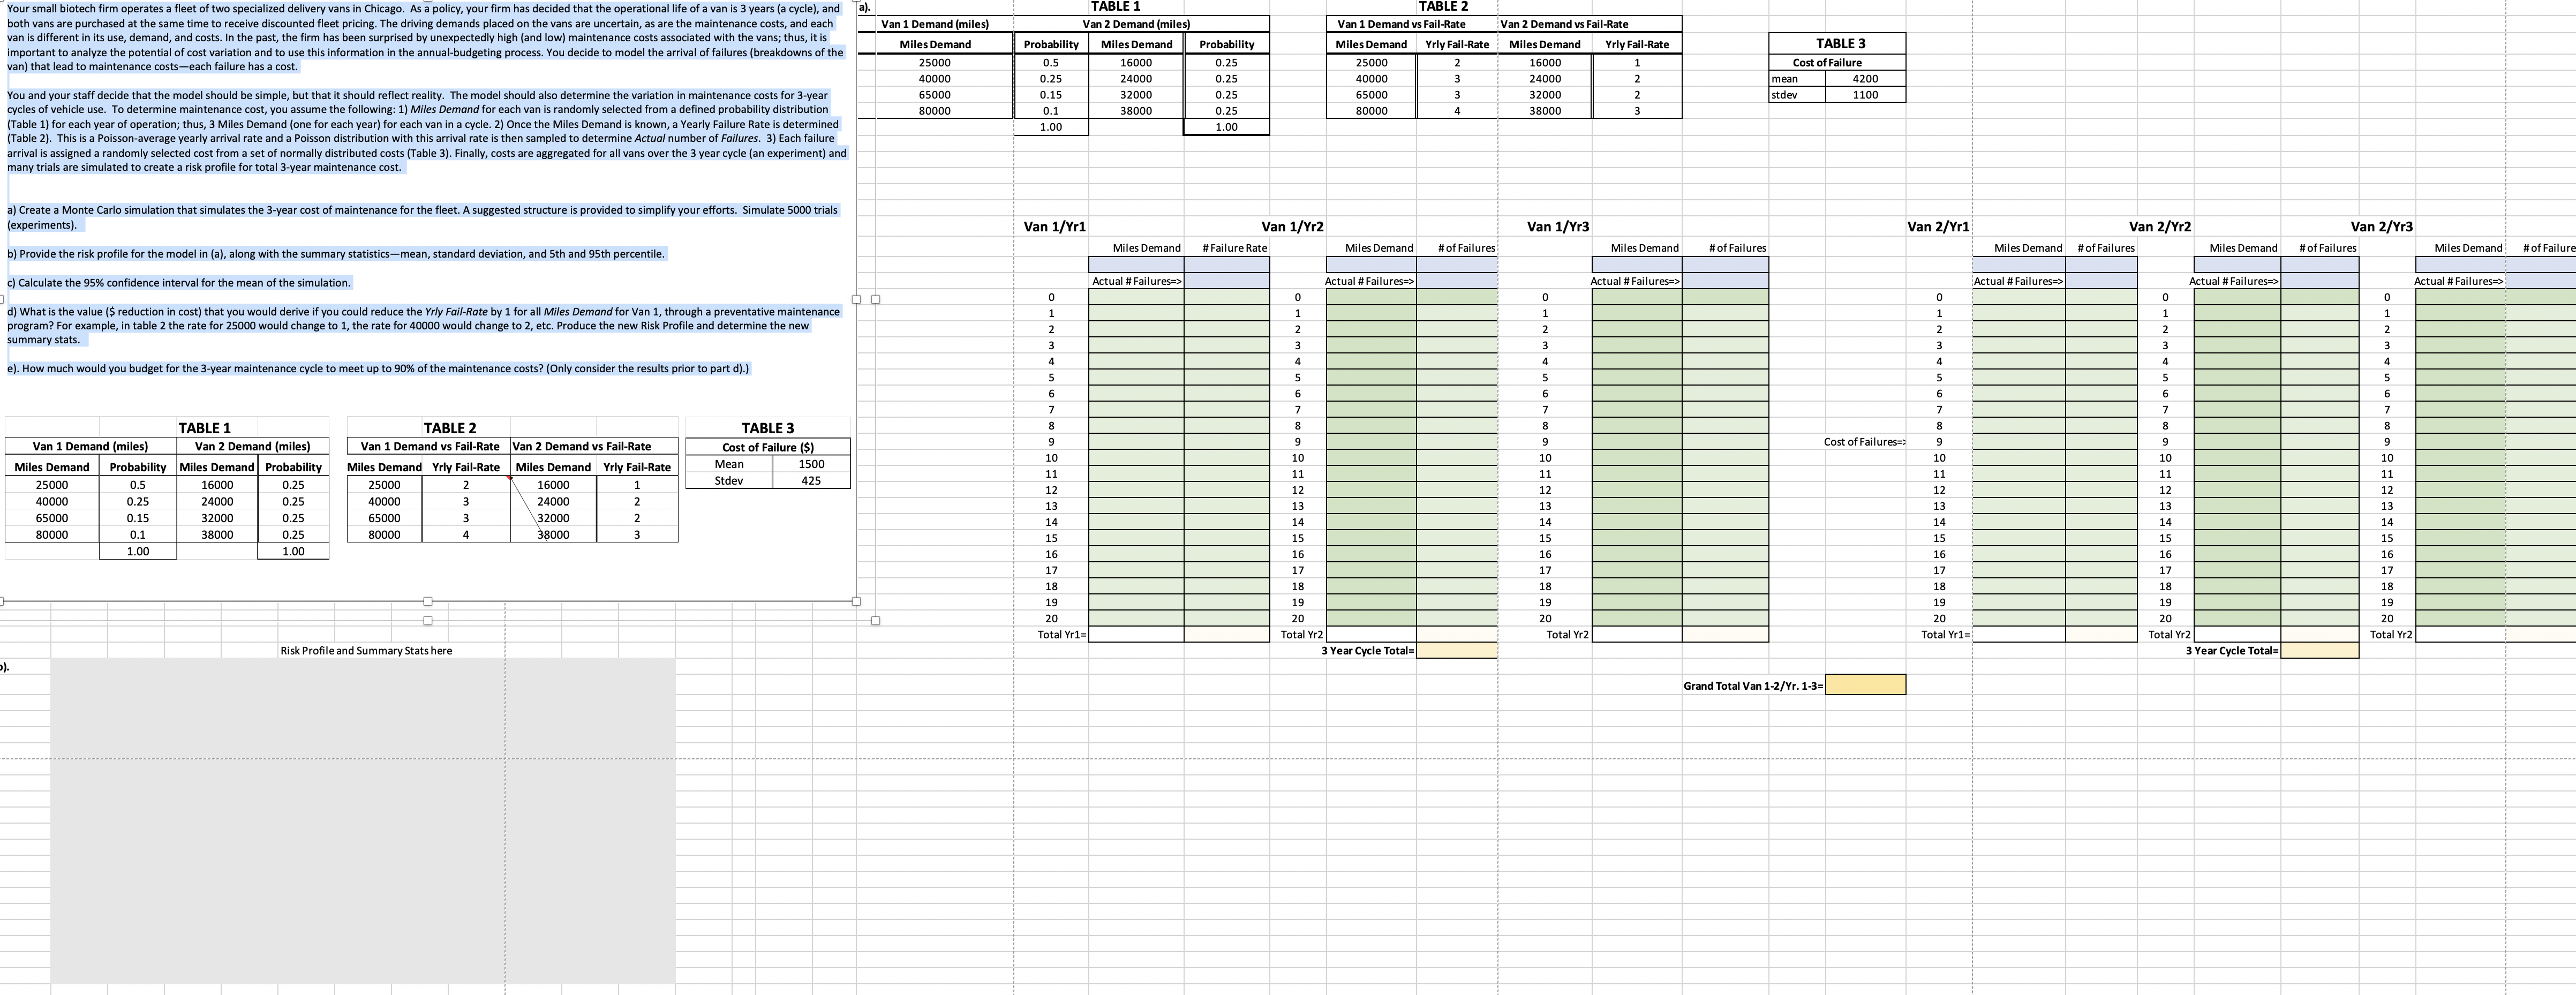
Your small biotech firm operates a flee n is 3 years (a cycle), and TABLE both vans are purchased at the same time to receive discounted fleet pricing. The driving demands placed on the vans are uncertain, as are the maintenance costs, and each Van 1 Demand (miles Van 2 Demand (miles Van 1 Demand vs Fail-Rate Van 2 Demand vs Fail-Rate van is different in its use, demand, and costs. In the past, the firm has been surprised by unexpectedly high (and low) maintenance costs associated with the vans; thus, it is important to analyze the potential of cost variation and to use this information in the annual-budgeting process. You decide to model the arrival of failures (breakdowns of the Miles Demand Probability Miles Demand Probability Miles Demand Yrly Fail-Rate Miles Demand Yrly Fail-Rate TABLE 3 van) that lead to maintenance costs-each failure has a cost. 25000 0.5 16000 0.25 25000 16000 Cost of Failure 40000 0.25 24000 0.25 4000 24000 4200 You and your staff decide that the model should be simple, but that it should reflect reality. The model should also determine the variation in maintenance costs for 3-year 65000 0.15 32000 0.25 5500 w w $2000 1100 cycles of vehicle use. To determine maintenance cost, you assume the following: 1) Miles Demand for each van is randomly selected from a defined probability distribution 38000 WNA mean stdev 0.1 0.25 38000 or each year of operation; thus, 3 Miles Demand (one for each year) for each van in a cycle. 2) Once the Miles Demand is known, a Yearly Failure Rate is determined 80000 (Table 2). This is a Poisson-average yearly arrival rate and a Poisson distribution with this arrival rate is then sampled to determine Actual number of Failures. 3) Each failure 1.00 1.00 arrival is assigned a randomly selected cost from a set of normally distri many trials are simulated to create a risk profile for total 3-year maintenance cost. ormally distributed costs (Table 3). Finally, costs are aggregated for all vans over the 3 year cycle (an experiment) and a) Create a Monte Carlo simulation that simulates the 3-year cost of maintenance for the fleet. A suggested structure is provided to simplify your efforts. Simulate 5000 trials experiments). Van 1/Yr1 Van 1/Yr2 Van 1/Yr3 Van 2/Yr1 Van 2/Yr2 Van 2/Yr3 b) Provide the risk profile for the model in (a), along with the sum in, standard deviation, and 5th and 95th percentile. Miles Demand # Failure Rate Miles Demand # of Failures Miles Demand # of Failures Miles Demand # of Failures Miles Demand # of Failures Miles Demand # of Failur c) Calculate the 95% confidence interval for the mean of the simulation. Actual # Failures=> Actual # Failures= Actual # Failures=> Actual # Failures=> Actual # Failures=> Actual # Failures=> d) What is the value ($ reduction in cost) that you would derive if you could reduce the Yrly Fail-Rate by 1 for all Miles Demand for Van 1, through a preventative maintenance rogram? For example, in table 2 the rate for 25000 would change to summary stats . 00 would change to 1, the rate for 40000 would change to 2, etc. Produce the new Risk Profile and determine the new e). How much would you budget for the 3-year maintenance cycle to meet up to 90% of the maintenance costs? (Only consider the results prior to part d).) VOUIA W NHC TABLE 1 TABLE 2 TABLE 3 Van 1 Demand (miles) Van 2 Demand (miles) Van 1 Demand vs Fail-Rate Van 2 Demand vs Fail-Rate Cost of Failure ($) Cost of Failures= Miles Demand Probability Miles Demand Probability Miles Demand Yrly Fail-Rate Miles Demand Yrly Fail-Rate Mean 1500 10 11 DO YOUI A W N H DO VOU A W N H O 10 10 25000 0.5 1600 0.25 25000 2 16000 Stdev 425 4000 65000 0.25 24000 0.25 40000 24000 12 12 0.15 32000 0.25 65000 w w 32000 13 80000 0.1 38000 0.25 W N 1.00 80000 38000 17 16 18 10 19 20 20 20 20 Total Yr1= Total Yr2 3 Year Cycle Total= Total Yr2 Total Yr2 Total Yr2 Risk Profile and Summary Stats here 3 Year Cycle Total= Grand Total Van 1-2/Yr. 1-3=
Step by Step Solution
There are 3 Steps involved in it

Get step-by-step solutions from verified subject matter experts